|

Gold Elliott Wave technical analysis [Video]

Gold Elliott Wave analysis

Long-term outlook

Gold maintains a bullish stance over the long term. After rebounding from the decline that started on April 22, the market now aims to surpass its previous high and potentially set a new record. In the short term, the retracement from June 5 appears to have reached its low and could begin to recover soon.

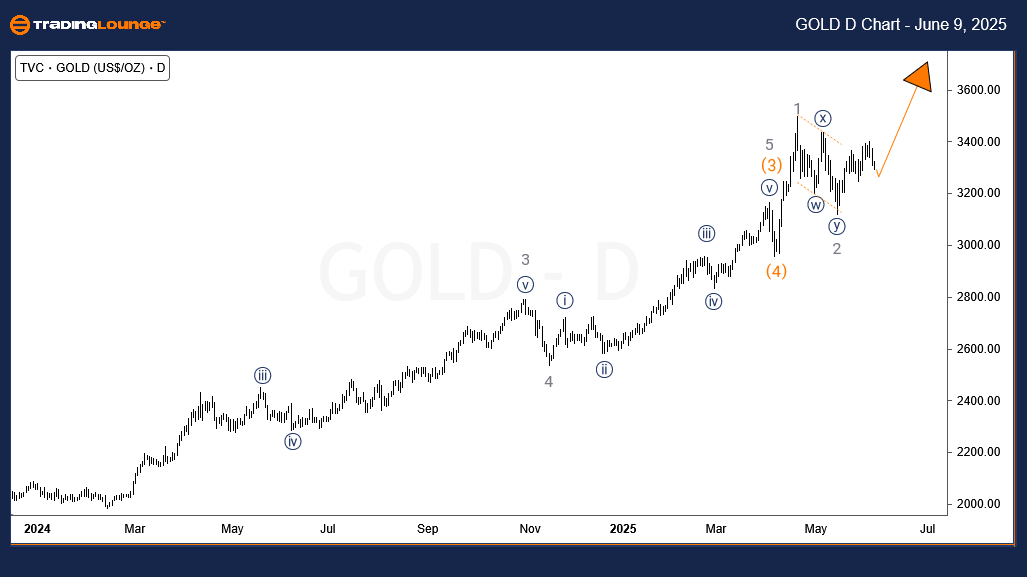
Gold daily chart analysis

From a structural perspective, Gold concluded the primary degree wave ((4)) of I of (III) in November 2022. Since then, the trend has consistently remained bullish, supported by minor pullbacks. Currently, it appears that wave ((5)) from the November 2022 low is still unfolding.

According to our analysis, the price is moving within wave (5) of ((5)) of I. Wave 1 of (5) concluded on April 21, 2025, followed by a corrective wave 2 of (5), which ended on May 14, 2025. Wave 3 of (5) began at this low and could stretch toward the 3878–4008 zone. This makes that range a key target for medium-term buyers accumulating during pullbacks.

Chart

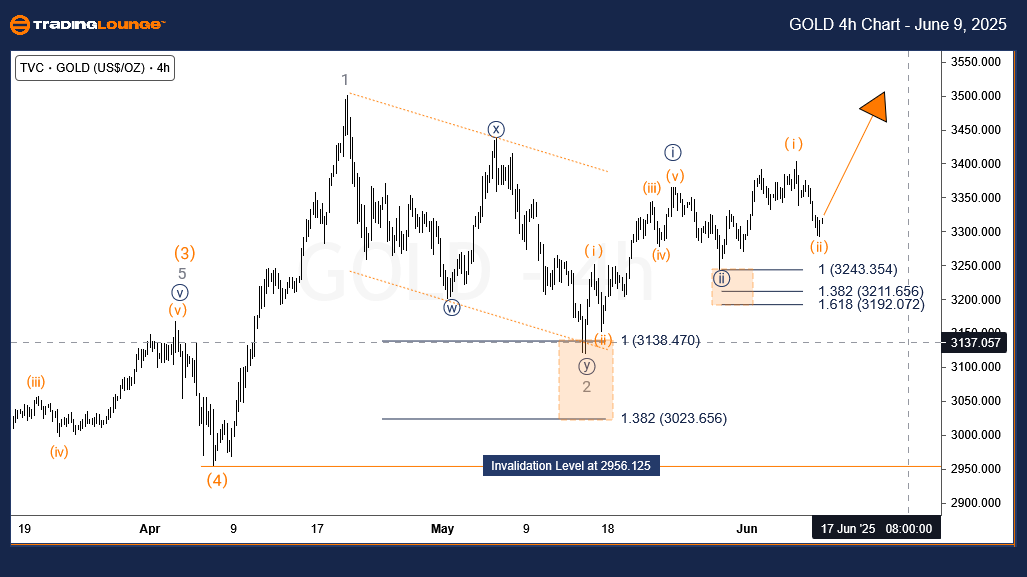
Gold four-hour chart analysis

In the H4 timeframe, wave ((i)) and ((ii)) of 3 appear to have finished on May 23 and May 28, respectively. A 5-wave rally followed, completing wave (i) of ((iii)). The most recent drop is identified as wave (ii) of ((iii)), which may extend to the 3510–3547 zone.

Alternatively, the dip from June 5 may still evolve into another downward leg on lower timeframes, forming a complete 5-wave decline. If so, wave ((i)) completed on May 23, and the structure may be forming an irregular flat for wave ((ii)) from that point. In both scenarios, the broader trend remains upward.

Gold

Gold Elliott Wave technical analysis [Video]

Author

Peter Mathers

Peter Mathers

TradingLounge

Peter Mathers started actively trading in 1982. He began his career at Hoei and Shoin, a Japanese futures trading company.

More from Peter Mathers
Share:

Editor's Picks

EUR/USD hits two-day highs near 1.1820

EUR/USD picks up pace and reaches two-day tops around 1.1820 at the end of the week. The pair’s move higher comes on the back of renewed weakness in the US Dollar amid growing talk that the Fed could deliver an interest rate cut as early as March. On the docket, the flash US Consumer Sentiment improves to 57.3 in February.

GBP/USD reclaims 1.3600 and above

GBP/USD reverses two straight days of losses, surpassing the key 1.3600 yardstick on Friday. Cable’s rebound comes as the Greenback slips away from two-week highs in response to some profit-taking mood and speculation of Fed rate cuts. In addition, hawkish comments from the BoE’s Pill are also collaborating with the quid’s improvement.

Gold climbs further, focus is back to 45,000

Gold regains upside traction and surpasses the $4,900 mark per troy ounce at the end of the week, shifting its attention to the critical $5,000 region. The move reflects a shift in risk sentiment, driving flows back towards traditional safe haven assets and supporting the yellow metal.

Crypto Today: Bitcoin, Ethereum, XRP rebound amid risk-off, $2.6 billion liquidation wave

Bitcoin edges up above $65,000 at the time of writing on Friday, as dust from the recent macro-triggered sell-off settles. The leading altcoin, Ethereum, hovers above $1,900, but resistance at $2,000 caps the upside. Meanwhile, Ripple has recorded the largest intraday jump among the three assets, up over 10% to $1.35.

Three scenarios for Japanese Yen ahead of snap election

The latest polls point to a dominant win for the ruling bloc at the upcoming Japanese snap election. The larger Sanae Takaichi’s mandate, the more investors fear faster implementation of tax cuts and spending plans. 

XRP rally extends as modest ETF inflows support recovery

Ripple is accelerating its recovery, trading above $1.36 at the time of writing on Friday, as investors adjust their positions following a turbulent week in the broader crypto market. The remittance token is up over 21% from its intraday low of $1.12.