|

Gold Elliott Wave technical analysis [Video]

Gold Elliott Wave analysis

It appears the current Gold pullback is completed and the commodity could be set to continue the all-time bullish trend to a fresh record high. From the Elliott wave theory perspective, Gold is expected to rally further to 2800 and beyond before the next pullback starts.

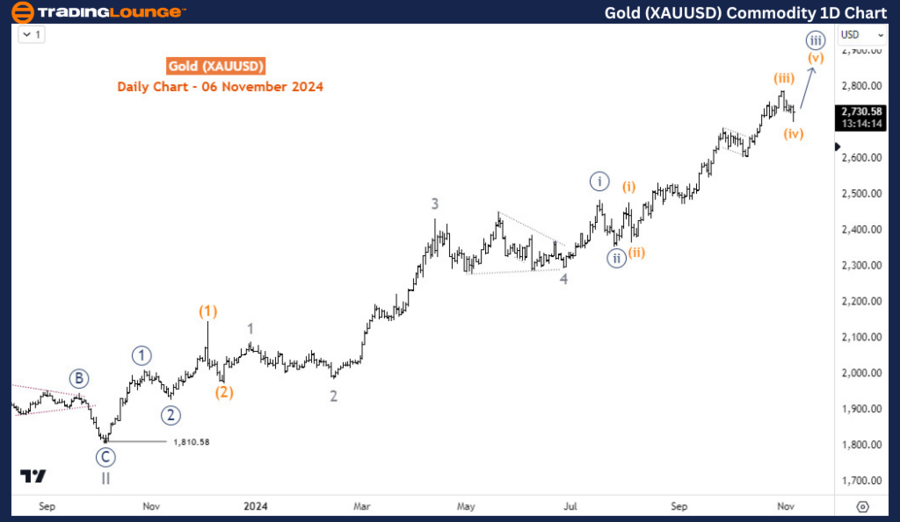
Daily chart analysis

On the daily chart, Gold completed the cycle degree wave II in October 2023 at 1810. Thus, the current bullish cycle can be traced to that date. Currently, the price is in wave ((iii)) of 5 of (3) of ((3)) of III. This indicates that Gold still has the potential to rally another 30-50% from the current price. Thus, buyers should be interested in buying pullbacks.

Gold

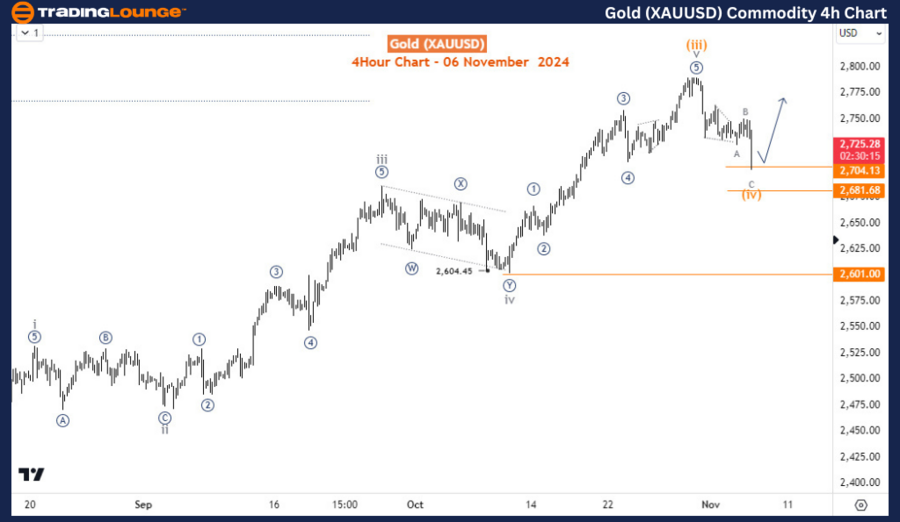
Four-hour chart analysis

On the H4 chart, the price is in wave (iv) of ((iii)) which appears to have finished or may do a double zigzag if the current bounce from 2701 is corrective. A zigzag structure has been completed and the next price action will determine whether recovery for wave (v) of ((iii)) will happen or wave (iv) will drop lower in a double zigzag structure. Whichever is the case, Gold is expected to continue to the upside to complete wave ((iii)) before the next pullback in ((iv)) starts.

XAUUSD

Gold Elliott Wave technical analysis [Video]

Author

Peter Mathers

Peter Mathers

TradingLounge

Peter Mathers started actively trading in 1982. He began his career at Hoei and Shoin, a Japanese futures trading company.

More from Peter Mathers
Share:

Markets move fast. We move first.

Orange Juice Newsletter brings you expert driven insights - not headlines. Every day on your inbox.

By subscribing you agree to our Terms and conditions.

Editor's Picks

EUR/USD bounces toward 1.1750 as US Dollar loses strength

EUR/USD returned to the 1.1750 price zone in the American session on Friday, despite falling Wall Street, which indicates risk aversion. Trading conditions remain thin following the New Year holiday and ahead of the weekend, with the focus shifting to US employment and European data scheduled for next week.

GBP/USD nears 1.3500, holds within familiar levels

After testing 1.3400 on the last day of 2025, GBP/USD managed to stage a rebound. Nevertheless, the pair finds it difficult to gather momentum and trades with modest intraday gains at around 1.3490 as market participants remain in holiday mood.

Gold trims intraday gains, approaches $4,300

Gold retreated sharply from the $4,400  area and trades flat for the day in the $4,320 price zone. Choppy trading conditions exacerbated the intraday decline, although XAU/USD bearish case is out of the picture, considering growing expectations for a dovish Fed and persistent geopolitical tensions.

Cardano gains early New Year momentum, bulls target falling wedge breakout

Cardano kicks off the New Year on a positive note and is extending gains, trading above $0.36 at the time of writing on Friday. Improving on-chain and derivatives data point to growing bullish interest, while the technical outlook keeps an upside breakout in focus.

Economic outlook 2026-2027 in advanced countries: Solidity test

After a year marked by global economic resilience and ending on a note of optimism, 2026 looks promising and could be a year of solid economic performance. In our baseline scenario, we expect most of the supportive factors at work in 2025 to continue to play a role in 2026.

Crypto market outlook for 2026

Year 2025 was volatile, as crypto often is.  Among positive catalysts were favourable regulatory changes in the U.S., rise of Digital Asset Treasuries (DAT), adoption of AI and tokenization of Real-World-Assets (RWA).