Gold Elliott Wave Technical Analysis

Summary: A high may again be in place here or very soon indeed. When the new channel on the hourlychart is breached, then confidence may be had in this view. The target is now at 1,064 for the first weekly chart, and still 1,157 to 1,149 for the second weekly chart.
MAIN ELLIOTT WAVE COUNT
For clarity I have decided at this time it may be best to publish on a daily basis weekly charts I, II and IV. Both weekly charts I and II expect a zigzag down to complete and the di!erence is in the expected depth. Weekly chart IV has a very low probability and will only be given serious consideration if price makes a new high above 1,294.96.
WEEKLY CHART I
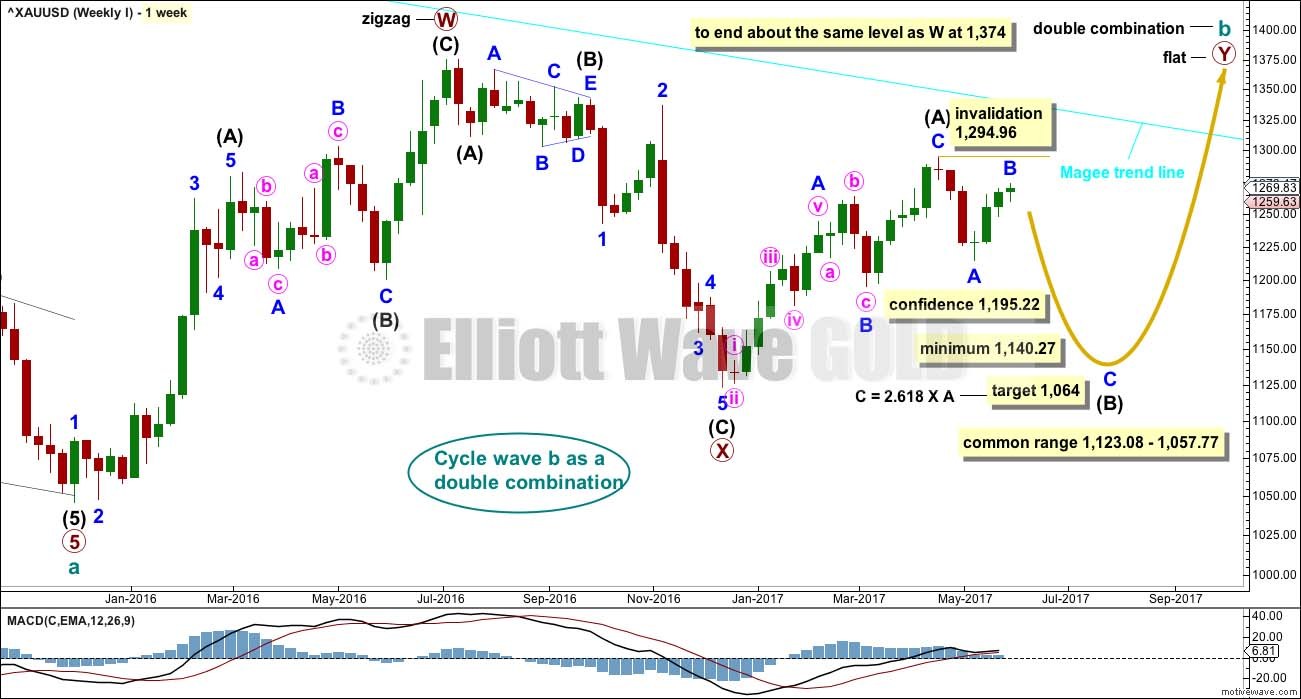
Combinations are very common structures. Cycle degree waves normally last one to several years, and B waves do tend to be more time consuming waves than all other waves. Given these tendencies the most likely scenario at this point may be that cycle wave b is an incomplete double combination.
The first structure in the double labelled primary wave W fits as a zigzag. This upwards movement will subdivide as either a three (zigzag) or a five (impulse). It does have a three wave look to it.
The double is joined by a deep three in the opposite direction labelled primary wave X, which is a 0.77 depth of primary wave W. X waves within double combinations are normally very deep; this one looks right.
The second structure in the combination may be either a triangle or a flat correction. Both of these structures have A waves which subdivide as threes.
At this stage, the upwards wave from the low in December 2016 does now look best and subdivide best as a completed zigzag. This may be intermediate wave (A) of a flat correction or a triangle. Because a triangle for primary wave Y would look essentially the same as the second weekly chart below, only a flat correction is considered here. The most common two structures in a double combination are a zigzag and a flat.
This wave count follows the most common scenario and has the best fit.
Within the flat correction of primary wave Y, intermediate wave (B) must retrace a minimum 0.9 length of intermediate wave (A) at 1,140.27. The most common length for intermediate wave (B) is from 1 to 1.38 times the length of intermediate wave (A), giving a common range from 1,123.08 to 1,057.77.
A target is now calculated for minor wave C to complete intermediate wave (B). This target would meet the minimum requirement for intermediate wave (B). Minor wave B has moved higher and the target is recalculated. At 1,064 minor wave C would exhibit a common Fibonacci ratio to minor wave A, and the minimum requirement for intermediate wave (B) would be met.
Intermediate wave (B) may subdivide as any corrective structure, but the most common structure for B waves within flats is a zigzag. At this stage, on the hourly chart it looks like a five down labelled minor wave A is complete, which would indicate intermediate wave (B) is a zigzag subdividing 5-3-5.
The daily and hourly charts will follow this weekly chart. That does not mean the other three weekly charts aren't possible, they are, but the number of charts must be kept reasonable on a daily basis.
The Magee bear market trend line is added to the weekly charts. This cyan line is drawn from the all time high for Gold on the 6th of September, 2011, to the first major swing high within the following bear market on the 5th of October, 2012. This line should provide strong resistance. If that resistance holds, then the second weekly chart would be correct.
WEEKLY CHART II
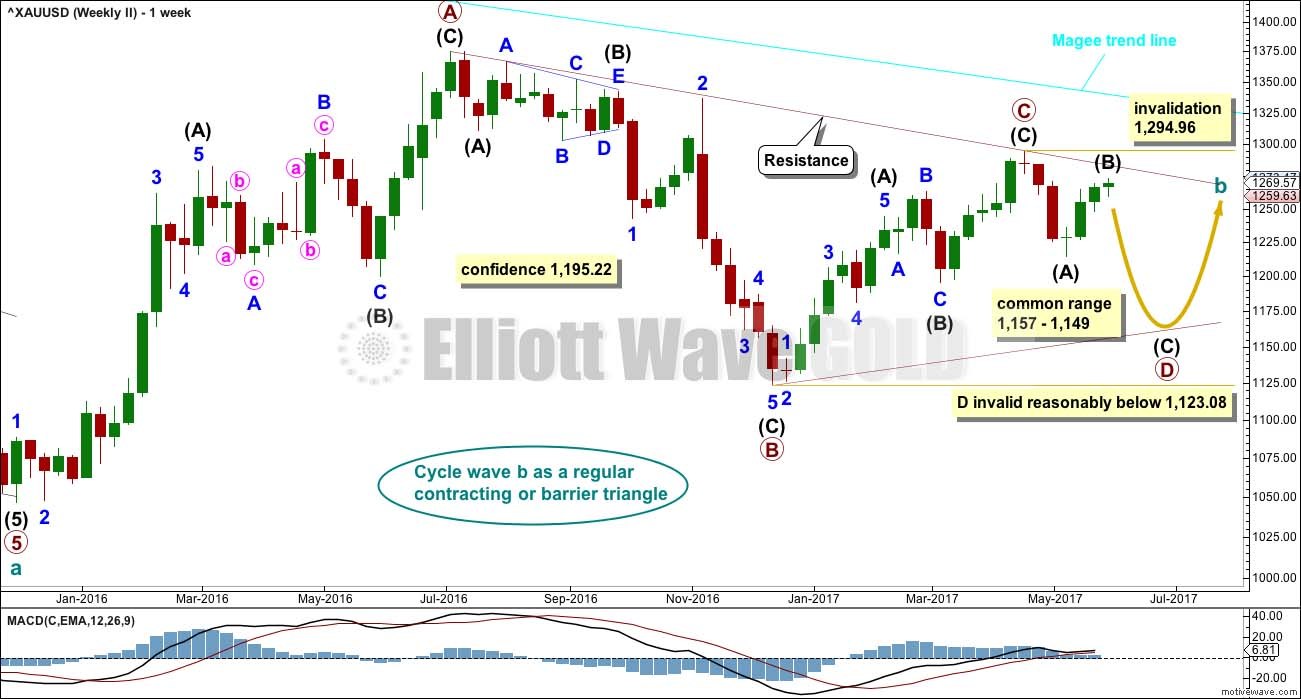
What if cycle wave b is a triangle? This is also entirely possible. Triangles are not as common as double combinations, but they are not uncommon.
Within the triangle, primary waves A, B and C are all single zigzags. One of the five subwaves of a triangle normally subdivides as a more complicated multiple, usually a double zigzag. This may be what is unfolding for primary wave D. It may also subdivide as a single zigzag.
Primary wave D of a regular contracting triangle may not move beyond the end of primary wave B below 1,123.08.
Primary wave D of a regular barrier triangle should end about the same level as primary wave B at 1,123.08, so that the B-D trend line is essentially flat. What this means in practice is that primary wave D may end slightly below 1,123.08 and the triangle would remain valid. This is the only Elliott wave rule which is not black and white.
Therea"er, primary wave E should unfold upwards and would most likely fall a little short of the A-C trend line. If not ending there, it may overshoot the A-C trend line. Primary wave E may not move beyond the end of primary wave C above 1,294.96.
Triangles normally adhere very well to their trend lines. Occasionally, price may overshoot the trend lines but when this happens it is not by much and is quickly reversed. The upper A-C trend line should o!er very strong resistance at this stage if cycle wave b is unfolding as a triangle. This trend line is added to the daily chart below.
At this stage, the structure on the hourly chart is still the same for both this weekly wave count and the first weekly wave count: a zigzag downwards is unfolding. However, they now diverge in how far down the next wave is expected to go. This second weekly wave count expects a more shallow movement to not end reasonably below 1,123.08.
DAILY CHART
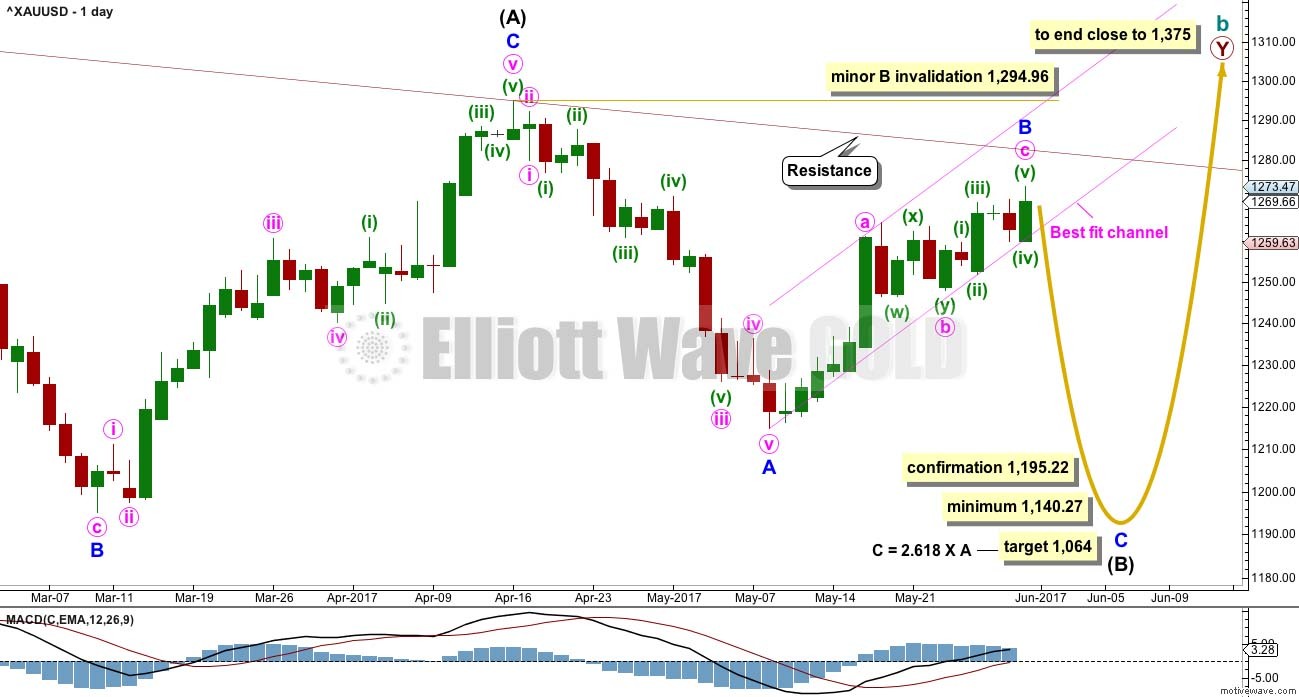
This daily chart will su!ice for both weekly charts above, although the labelling follows weekly chart I.
Both weekly charts expect a zigzag downwards. (It may also turn out to be a double zigzag. For now a single only will be charted but a double will be kept in mind). Weekly chart I expects a deep zigzag for intermediate wave (B) to a minimum at 1,140.27. Weekly chart II expects a zigzag down for primary wave D to not move below 1,123.08 and most likely fall well short of that point.
The daily chart follows the expectations for weekly chart I, but the structure for weekly chart II would be exactly the same at this stage.
Within the flat correction of primary wave Y, intermediate wave (B) must retrace a minimum 0.9 length of intermediate wave (A) at 1,140.27. The most likely corrective structures to achieve the deep correction required for B waves within flats are single or multiple zigzags. These begin with a five, then a three in the opposite direction. Minor wave A is complete.
Minor wave B may now be a complete zigzag.
Minor wave B may not move beyond the start of minor wave A above 1,294.96.
MAIN HOURLY CHART
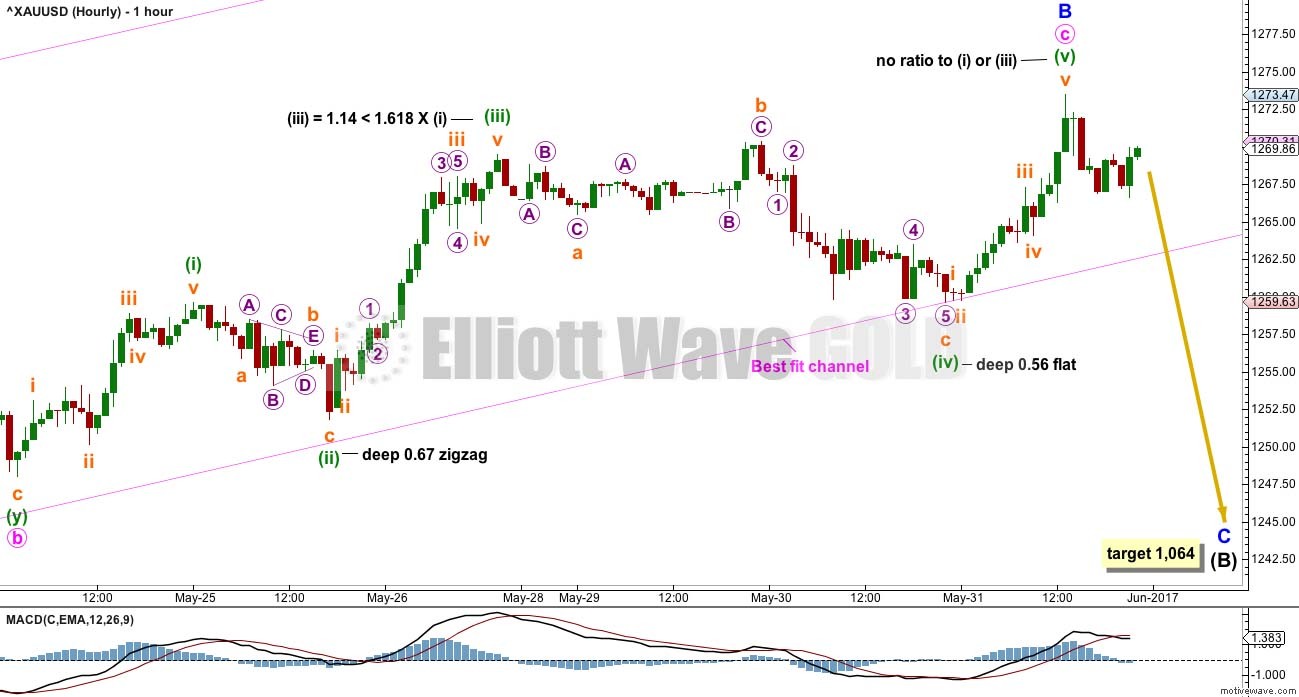
Minute wave b may be a complete double combination. These are very common structures. The most common combination of corrective structures in a double is a zigzag and a flat.
Minute wave c continued higher during Wednesday's session. Within minute wave c, there is still alternation between minuette waves (ii) and (iv).
The channel about minor wave B is adjusted today to contain all of its movement. When price clearly breaks below the lower edge of this channel, that shall provide some confidence in a possible trend change.
ALTERNATE HOURLY CHART
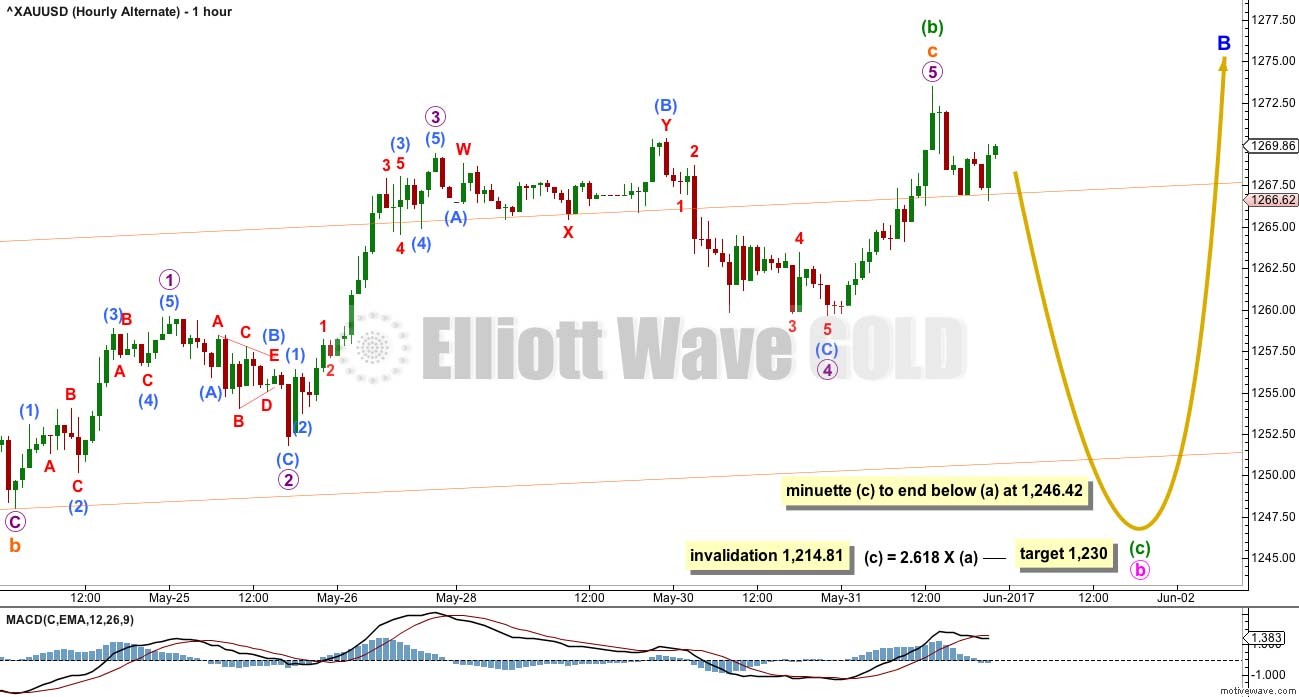
What if a flat correction is still unfolding for minute wave b and minuette wave (b) within it is still incomplete?
Both waves A and B subdivide as threes within minute wave b, as they must for a flat correction.
There is now a problem within this wave count of the regular flat of minuette wave (b). Higher movement during Wednesday's session now sees subminuette wave c close to 1.618 the length of subminuette wave a; within regular flats, C waves are normally close to even in length with wave A. This reduces the probability of this alternate a little further today because it no longer has the right look.
This wave count allows for further sideways movement in an ever increasing range.
WEEKLY CHART IV
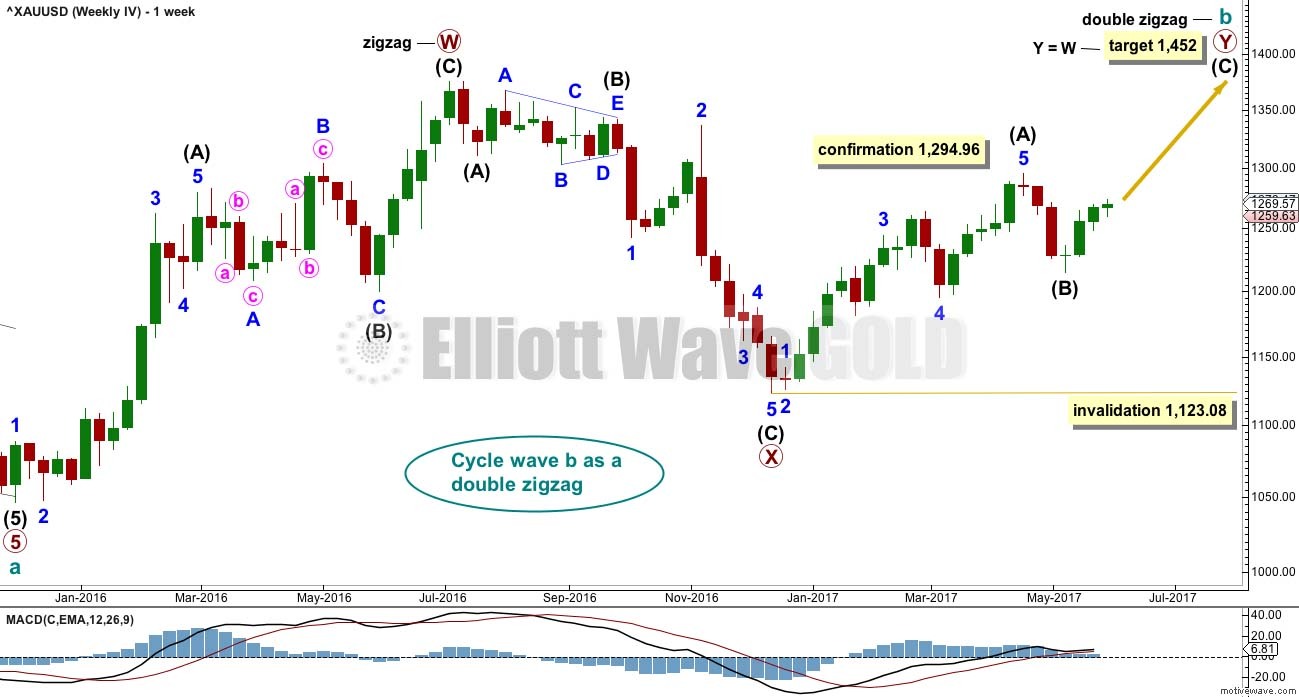
What if the bull market beginning in December 2015 remains intact? Price has essentially been moving sideways since that date, so all possibilities should be considered.
The Morning Doji Star at the low labelled intermediate wave (B) will not be considered as a reversal pattern here because it comes in what is essentially a sideways movement. It does not come a"er a downwards wave, so there is nothing to reverse.
This wave count requires confirmation above 1,294.96. That would invalidate the first three weekly charts (the third is seen in historic analysis only).
It is possible that cycle wave b is continuing higher as a double zigzag. However, double zigzags normally have brief and shallow X waves. The purpose of the second zigzag in a double (and the third when there is one) is to deepen the correction when price does not move deep enough in the first (or second) zigzag. Thus double (and triple) zigzags normally have a strong and clear slope against the prior trend. To achieve this look their X waves normally are brief and shallow.
In this case, primary wave X is neither brief nor shallow. It is a 0.77 depth of primary wave W and lasted 0.74 the duration of primary wave W. Overall, this does not have a typical look of a double zigzag so far. This wave count also must see the rise up to the high labelled intermediate wave (A) as a five wave impulse, not a three wave zigzag.
This looks a little forced, so it reduces the probability of this wave count. This wave count should only be used if confirmed with a new high above 1,294.96. Low probability does not mean no probability, but should always be given less weight until proven.
TECHNICAL ANALYSIS
WEEKLY CHART
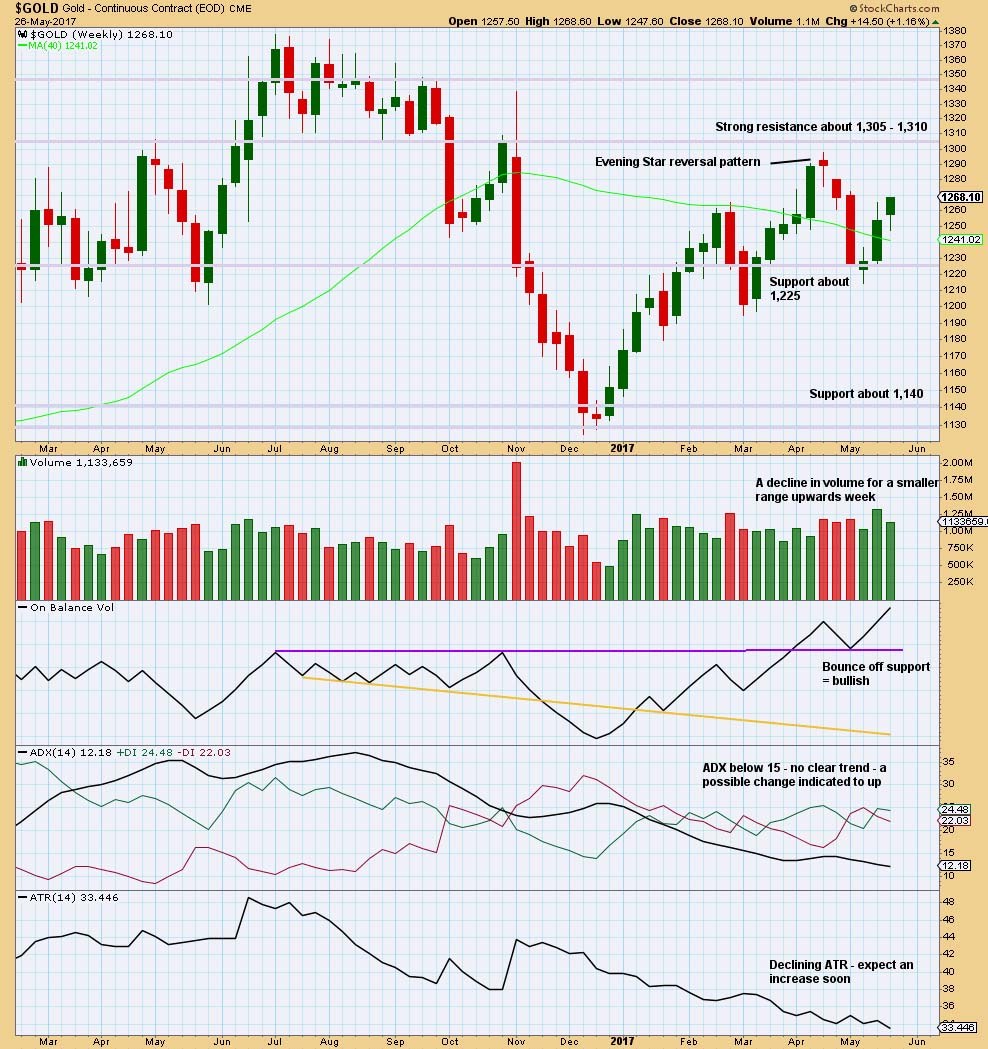
The decline in volume is bearish, but it does not mean upwards movement must stop here. Price can continue higher on declining volume for another few weeks before a trend change as it did in February of this year.
On Balance Volume remains bullish. The long lower wick on this weekly candlestick is bullish.
ATR is bearish.
Overall, this chart is slightly bullish.
DAILY CHART
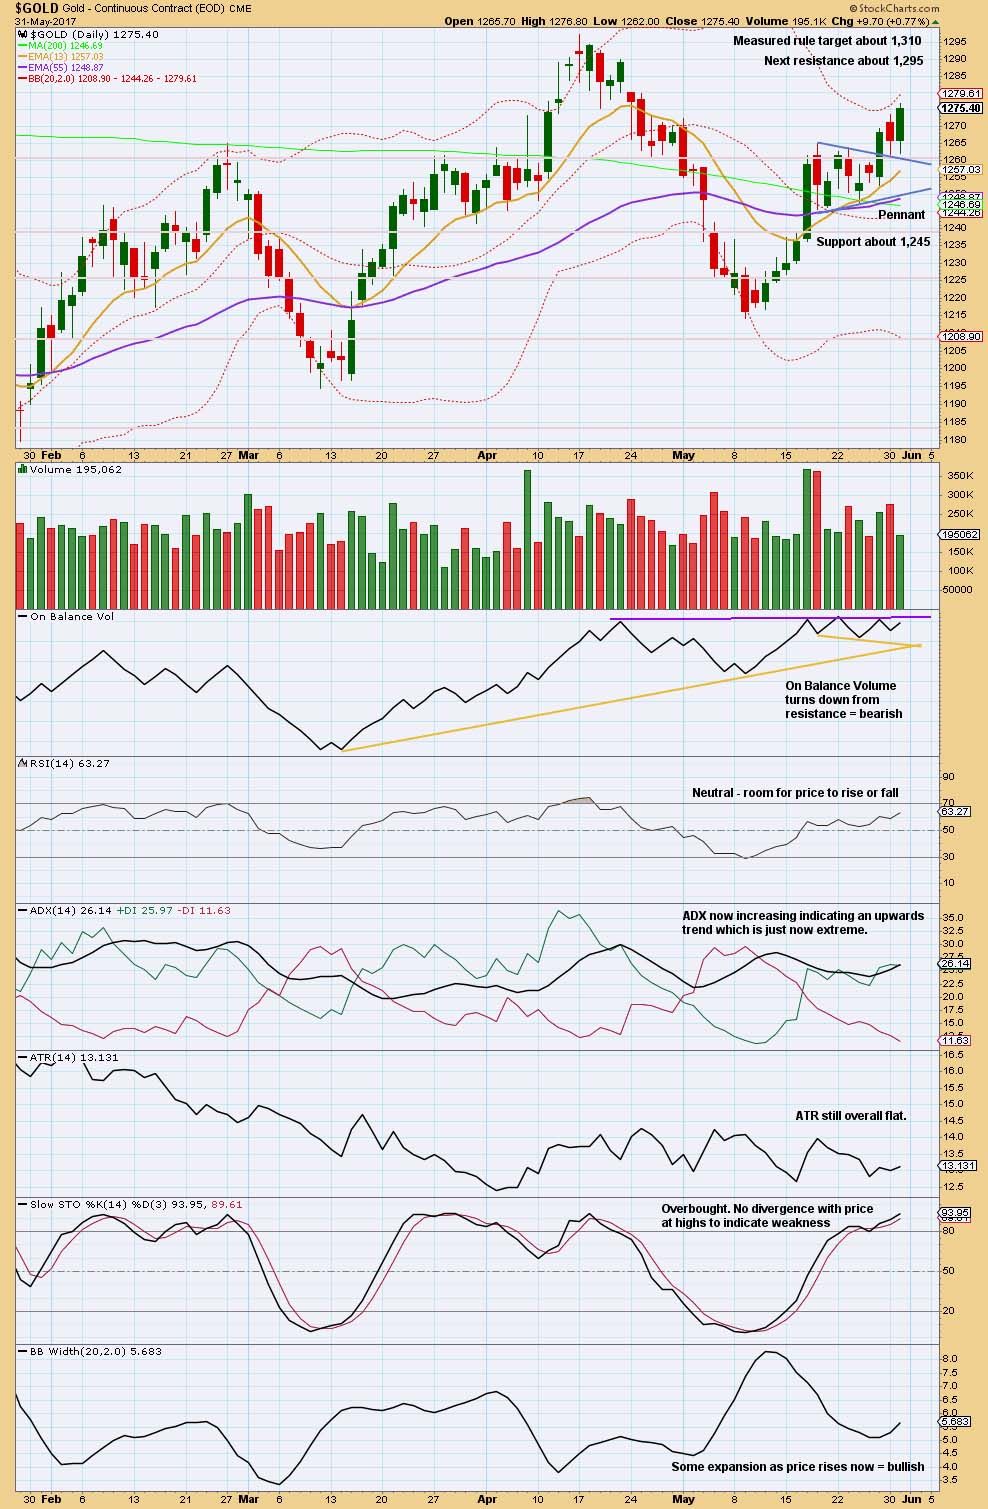
Wednesday's session moved price higher but with lighter volume. On Balance Volume is very close to resistance. ADX is just now extreme. Together this looks like a high may be in place here or very soon indeed.
Apart from the upwards day of the 17th of May, which looks like a blowo! top, strongest volume is for downwards days. This is bearish.
GDX
DAILY CHART
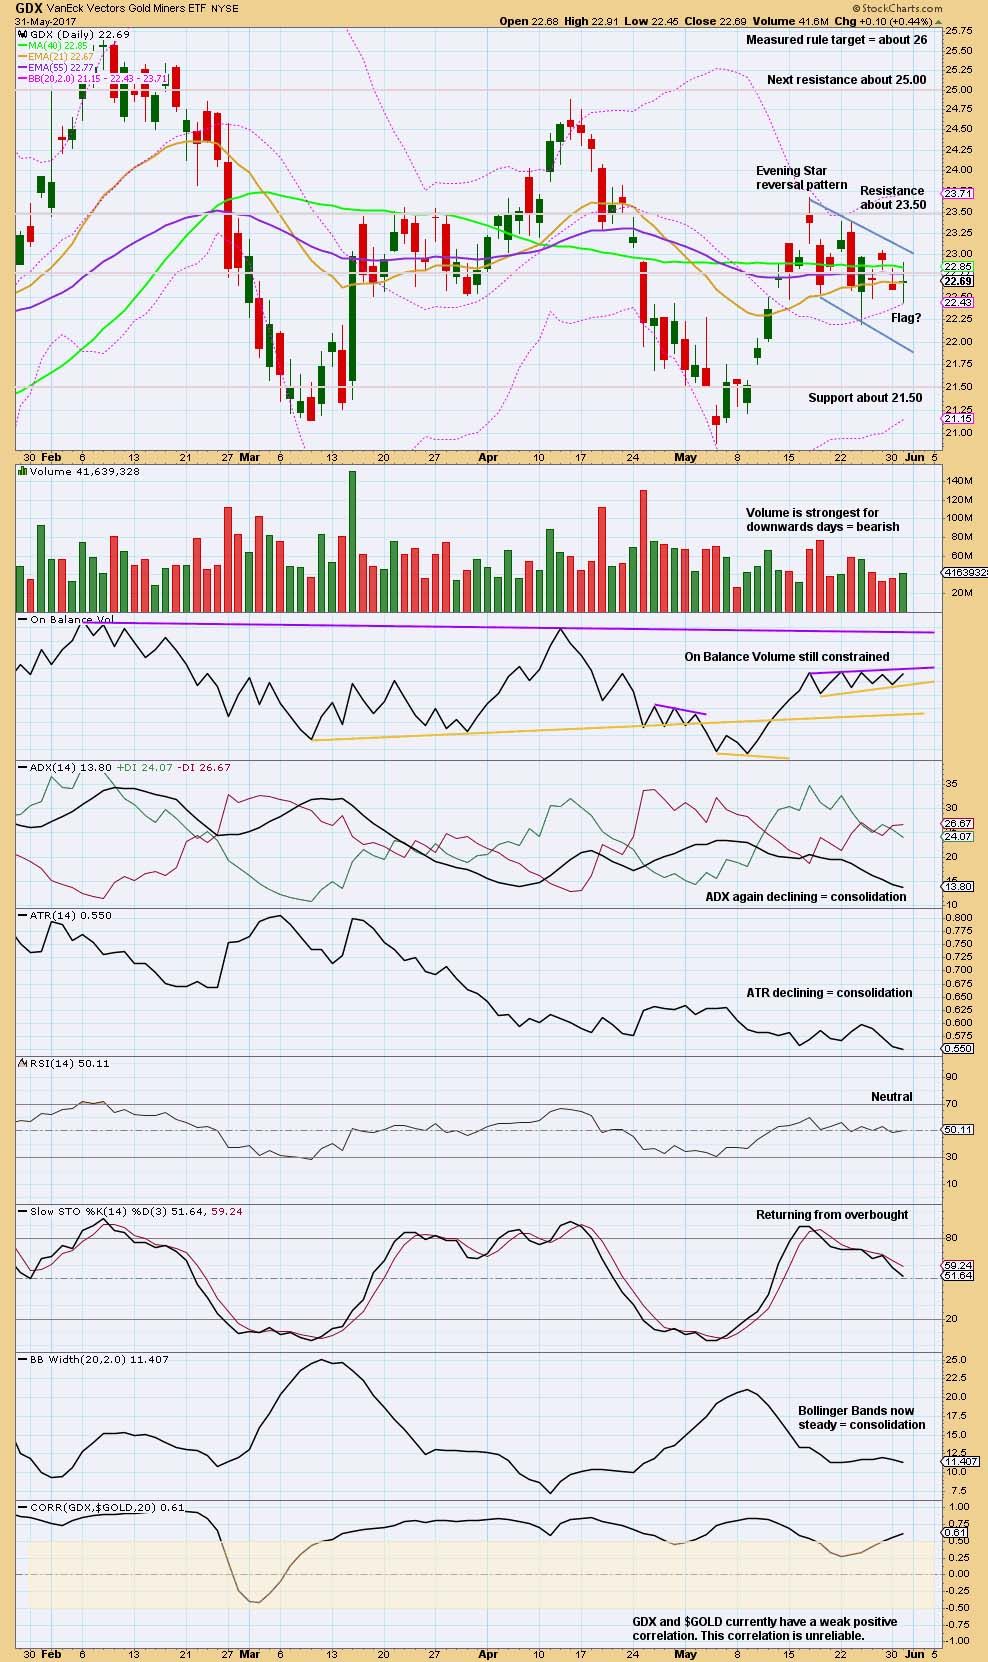
The weak bearish signal noted yesterday from On Balance Volume was today negated. The yellow support line is redrawn.
A slight increase in volume for today's outside day, which had a balance of volume upwards, is slightly bullish.
The flag pattern is a continuation pattern and the breakout is expected to be upwards.
This is contradicted by the recent volume profile supporting downwards movement over upwards.
On Balance Volume will again be watched carefully. A breakout there may indicate the next direction for price
Author

Lara Iriarte, CMT
Elliott Wave Gold
Lara Iriarte is a Chartered Market Technician and a Registered Financial Advisor in New Zealand.


