Gold Elliott Wave analysis [Video]
![Gold Elliott Wave analysis [Video]](https://editorial.fxstreet.com/images/Markets/Commodities/Metals/Gold/stacks-of-gold-bars-19033163_XtraLarge.jpg)
Gold Elliott Wave analysis
Function - Trend.
Mode - Impulse.
Structure - Impulse wave.
Position - Wave 5.
Direction - Wave 5 is still in progress.
Details - Impulse breakout for wave 5 progresses. Upside is still favored. Same interpretation as the previous one.
The invalidation level is below 2276.
After three weeks of correcting its long-term bullish cycle, the metal is now resuming its upward trend. Unless a sharp decline occurs, the potential for further rallies remains strong. This blog post examines the entire bullish cycle from October 2023 and the current price position within the Elliott wave framework of the impulse rally.
On the daily chart, the renewed strength began in October 2023 when the 12% decline from May 2023 ended at 1810.5. This bullish move can be traced back to the September 2022 low of 1616.9, where the 4th wave of a supercycle degree impulse, which started in late 2015, concluded. Therefore, the bullish progress since 1616.9 is part of wave (V) of the supercycle degree. According to Elliott wave principles, this signifies a powerful and extended move, as supercycle waves typically encompass large and sustained price changes.
The daily chart indicates that the price is in wave III of (V), which hasn't yet completed its 3rd sub-wave of the primary degree in blue. Wave III is typically the most dynamic and extended phase of an impulse wave, often characterized by strong price movements and high momentum. Within this context, the bullish potential for Gold is substantial and suggests an extended upward trajectory that could last for several years.
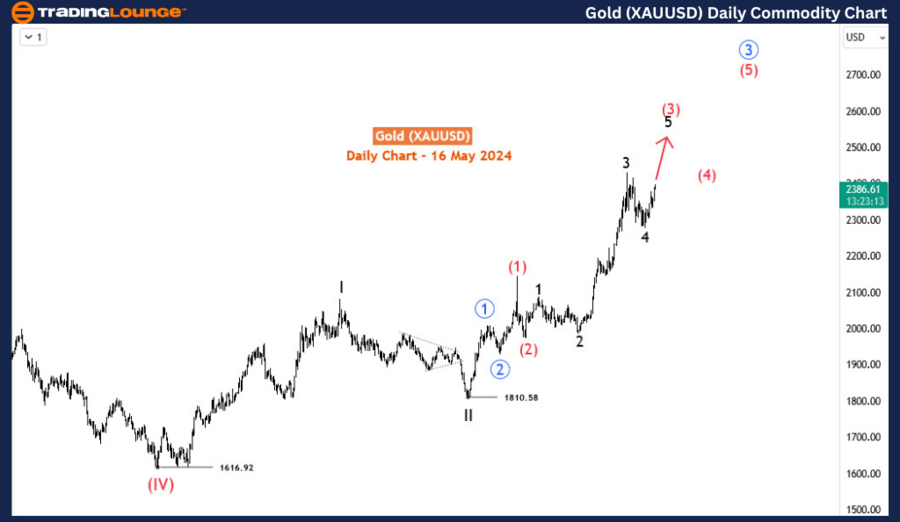
Currently, Gold is in wave 5 of (3) of the blue '3'. This final wave 5 of (3) is crucial as it will complete the larger wave III structure before a more significant correction occurs. Based on wave analysis, wave 5 has not yet ended and could extend to the 2463-2500 range or even higher in the coming weeks. This projection aligns with the typical behavior of wave 5, which often stretches to new highs, fueled by the final burst of investor enthusiasm.
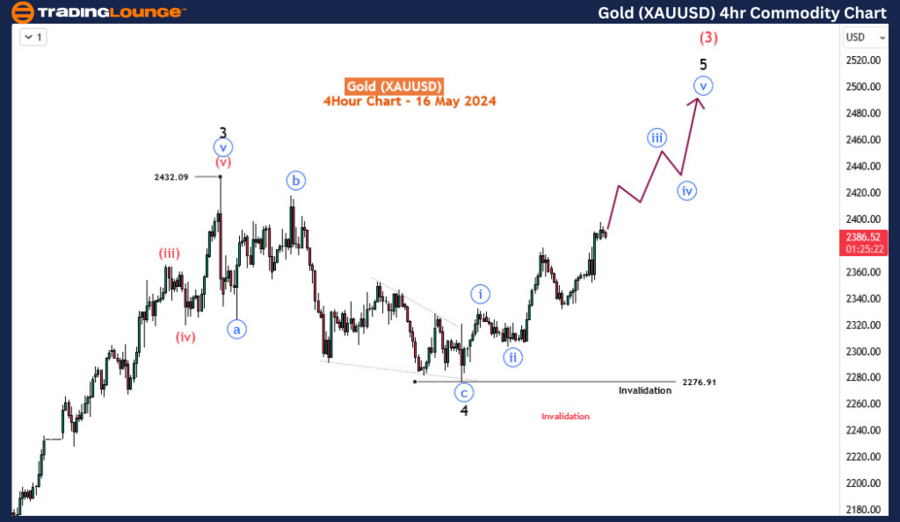
On the H4 chart, we observe that wave 4 ended with a classic zigzag structure, a common corrective pattern that sets the stage for the next impulse wave. Following this, wave 5 has begun to emerge, indicating a resumption of the bullish trend. The price is currently in the minute degree (circled in blue) wave iii of 5. As long as the price remains above 2276, the impulse for wave 5 is expected to continue its ascent in the near term.
In summary, the Elliott wave analysis points to a strong bullish outlook for the metal, with significant upward potential remaining. Traders should watch for further gains and consider buying on dips, as the long-term trend supports continued appreciation.
Gold Elliott Wave analysis [Video]
Author

Peter Mathers
TradingLounge
Peter Mathers started actively trading in 1982. He began his career at Hoei and Shoin, a Japanese futures trading company.


