Gold during Reflations

Reflation is coming. We argue that the recent comeback of inflation is negative for the gold market. Why should that be so? Should not inflation support gold, which is considered the inflation hedge? It is true that gold may shine during inflationary times, but a lot depends on the broader macroeconomic picture. Gold entered a bull market in the 1970s, but the U.S. economy was in a stagflation then, i.e. the combination of high inflation and sluggish economic growth. And inflation was high and accelerating. Will this scenario replay now?
The risk of stagflation, and the resulting possibility of a bond market collapse, is one of the largest risks for 2017 pointed out by investors. However, the current rise in inflation seems to reflect the uptick in economic activity and the jump in commodity prices. In other words, we see the return to normality after years of stubbornly low inflation rather than the start of high inflationary pressure. The deflationary forces are still in operation and the rise in oil prices should be limited by the increase in its supply, due to the fracking revolution. Therefore, the recent comeback of inflation should not support gold, as it results from higher economic growth and as it normalizes, not accelerates price dynamics. To put it simply, the increasing interest rates should keep inflation in check, so the yellow metal should not get an inflationary boost.
Other analysts point out that the central banks tighten monetary policy too much in a response to the inflation, which could hamper the economic growth or even lead to a recession. Well, it is possible, but central banks remain accommodative. Surely, they can overshoot, but it will take time to cause some turmoil and support gold (the same applies to the risk of inflation getting out of control – it will not happen suddenly). Therefore, the medium-term outlook for gold looks rather bearish, at least until the long-term upward trend in the U.S. dollar and real interest rates reverses.
Let’s now analyze some historical cases of reflation. As one can see in the chart below, the 1970s high inflation corresponded to the bull market in gold. However, it was a period of stagflation and the inflation rate was definitely above the trend. Meanwhile reflation is rather the rebound of the inflation rate when it has fallen below the trend line. There have been a few periods of so defined reflations: the beginning of 1987, 1998-1999, 2002-2004, 2009-2011, and the period since 2015 until today.
Chart 1: The price of gold (yellow line, left axis, London P.M. Fix) and the CPI rate (red line, right axis, annual rate) from 1971 to 2016.
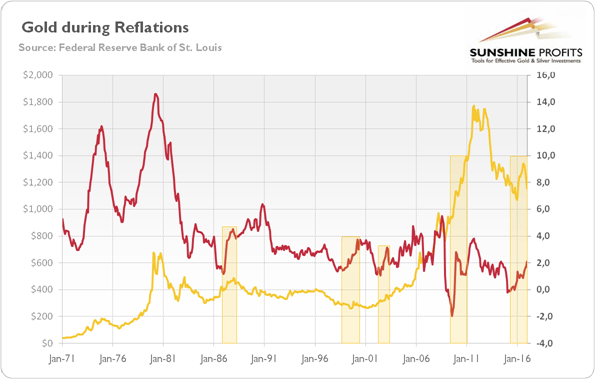
How did gold perform then? The price of gold rose in the first half of 1987, but it declined later, despite the fact that inflation accelerated. In 1998-1999, the yellow metal continued its free-fall, but in the 2000s reflations were positive for gold. However, in the 2000s, the macroeconomic situation deteriorated: the GDP growth slowed down, the federal public debt soared, while the U.S. dollar plunged.
Therefore, the Reagan-Volcker era was negative for gold, as inflation was curbed, the greenback soared, and the economic activity accelerated. Clinton’s economic policy was also bad for gold, as he improved the fiscal position of the U.S., even achieving budget surpluses after years of fiscal deficits. Meanwhile, the economic policies of Bush W. were catastrophic for the U.S. economy, but positive for the yellow metal. The reflation during the first term of Obama also supported gold (however, during the second term gold went into free-fall).
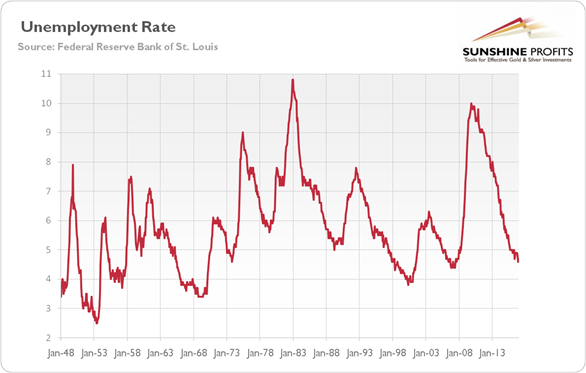
Hence, the performance of gold during the current reflation will depend not only on the price dynamics, but on the broader economic picture. The key is whether the Trump’s agenda will be more similar to Reagan’s or Bush’s measures and what will be the macroeconomic picture during Trump’s presidency. On the one hand, the structural reforms and some fiscal stimulus may accelerate growth. On the other hand, it is believed that the U.S. economy is already near full capacity. Indeed, the unemployment rate is probably bottoming out, as the chart below shows. It signals that Trump may be more like Bush than Reagan who came when the unemployment rate was surging.
Chart 2: The U.S. civilian unemployment rate (in %) between 1948 and 2016.
Indeed, it would be difficult for a new president to ignite economic growth, while keeping inflation and public debt under control. Well, this is good news for the gold bulls. However, the beginning of the presidency should be rather negative for the yellow metal, as the markets hope that Trump will really make America great again. As a reminder, gold shines when fear, not hope, dominates the scene.
Want free follow-ups to the above article and details not available to 99%+ investors? Sign up to our free newsletter today!
Author

Arkadiusz Sieroń
Sunshine Profits
Arkadiusz Sieroń received his Ph.D. in economics in 2016 (his doctoral thesis was about Cantillon effects), and has been an assistant professor at the Institute of Economic Sciences at the University of Wrocław since 2017.


