Gold drops below central pivot

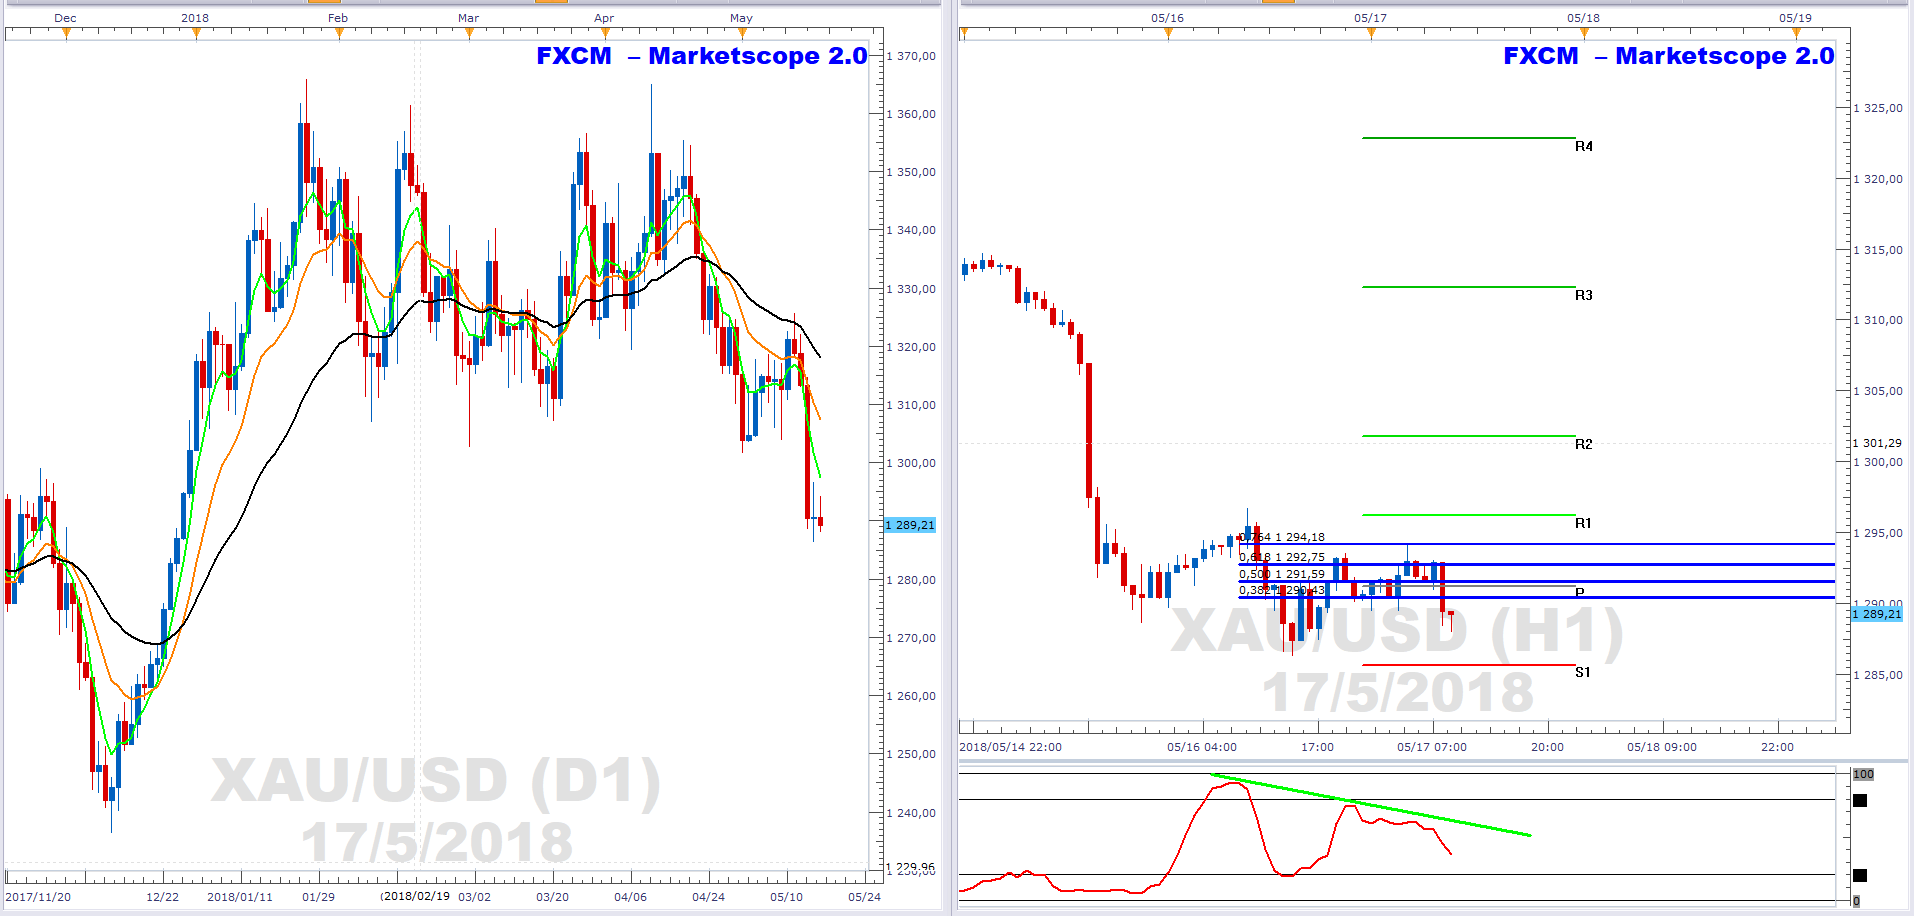
The left chart shows gold daily price action. As can be seen it is in mark-down phase. This is characterised by a bearish EMA formation. I.e. the green 5-day EMA is below the orange 13-day EMA, and the orange 13-day EMA is below the black 34-day EMA.
The right chart shows hourly price action. Price found resistance at a key level with a confluence of factors including, 76.4% Fibonaccia retracement, negative stochastic divergence and central pivot resistance.
Gold is inversely related to the USD. The higher US yields are pushing money into the USD to the detriment of gold. The strong US retail numbers that were released on Tuesday acted as the catalyst for the breakdown.
Author

Russell Shor (MSTA, CFTe, MFTA) has an Honours Degree in Economics from the University of South Africa and holds the coveted Certified Financial Technician and Master of Financial Technical Analysis qualifications from the Interna


