Gold dips below key level amid Fed caution and manufacturing slowdown

Gold (XAU/USD) is pulling back after a strong rally in recent weeks. The decline follows hawkish signals from the Federal Reserve that have reduced expectations for more rate cuts this year. Fed Chair Jerome Powell warned that further easing is not guaranteed, prompting a shift in sentiment. Meanwhile, weakening U.S. manufacturing data is adding pressure to the Dollar and may support gold in the near term. With policy expectations shifting, gold is retesting support as attention turns to upcoming economic data.
Gold pulls back as Fed hawkishness tempers rate-cut expectations
Gold slipped below the $4,000 level as markets adjusted their outlook on future rate cuts. Market sentiment turned cautious after hawkish signals from Fed Chair Jerome Powell and other policymakers. Powell stated that another rate cut this year is "not a foregone conclusion," highlighting the central bank’s more cautious approach. This shift in tone weighed on gold, as investors scaled back expectations for near-term policy easing.
This follows the central bank's lowering of its benchmark rate to a range of 3.75%–4.00% at its October meeting. Even after the cut, Fed officials’ remarks have cooled hopes for further easing in December. Currently, markets are pricing a 69% probability of a 25-basis-point cut next month. Projections also suggest a total reduction of 82 basis points by the end of 2026, bringing the effective rate closer to 3.06%. These shifting expectations are weighing on gold in the short term.
However, disappointing U.S. manufacturing data may counterbalance the hawkish policy outlook. The ISM Manufacturing PMI dropped to 48.7 in October, marking a further contraction and missing the forecast of 49.5. This decline adds to concerns over broader economic softness, which could reignite demand for gold as a defensive asset.
Gold retests support after breakout from triangle and wedge formations
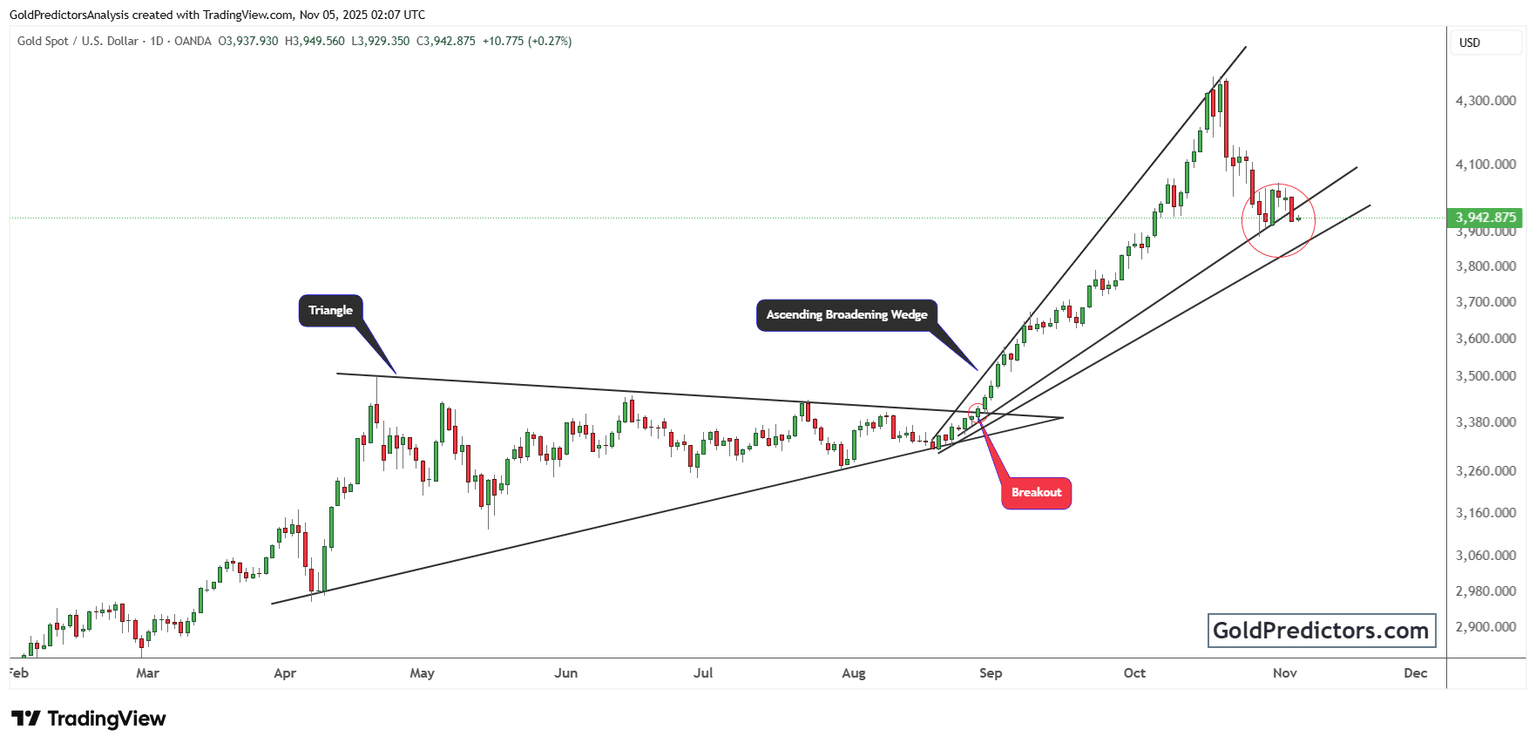
The gold chart below shows a decisive breakout from a well-formed triangle pattern. A symmetrical triangle emerged earlier in the year, acting as a consolidation phase for earlier upside moves. This triangle served as a base and transitioned into a larger, ascending, broadening wedge, signalling increased volatility and strengthening upward momentum.
In early September, gold broke out decisively from this triangle pattern. The breakout sparked a sharp rally, supported by rising volume and clear signs of institutional participation. Price surged beyond previous resistance levels, confirming the breakout zone and establishing a new phase of upside extension.
Gold’s recent pullback has returned the price to the support zone near the lower boundary of the rising wedge. The red circle in the chart marks this key zone, where buyers may step in to defend the trend. Despite pulling back from its peak, gold remains above its critical breakout levels. The current price behaviour suggests a typical retest rather than a breakdown. If this support holds, gold could resume its upward move with renewed strength.
Gold outlook: Pullback remains within bullish structure as key support holds
Gold remains in a strong technical structure despite recent weakness. The pullback reflects shifting Fed expectations, but broader macro risks and weakening data continue to support safe-haven demand. As price tests key support within the rising wedge, the bullish trend stays intact. Holding this support zone may set the stage for another upward push.
Unlock exclusive gold and silver trading signals and updates that most investors don’t see. Join our free newsletter now!
Author

Muhammad Umair, PhD
Gold Predictors
Muhammad Umair is a financial markets analyst and investor who focuses on the forex and precious metals markets.


