Gold cross confusion – Part 2

S2N spotlight
I love getting feedback. Yesterday a purist technical analyst told me that according to the strict technical definition of a golden cross, it is only a signal when the 50-day moving average crosses above the 200-day moving average when it is trending up. I never knew that, but this is a case where my late father’s motto of KISS (keep it simple, stupid) is once again good advice.
The massive performance difference between 18 True Golden Cross trades vs. 26 Simple Golden Cross trades comes down to missing 8 absolutely critical market entries.
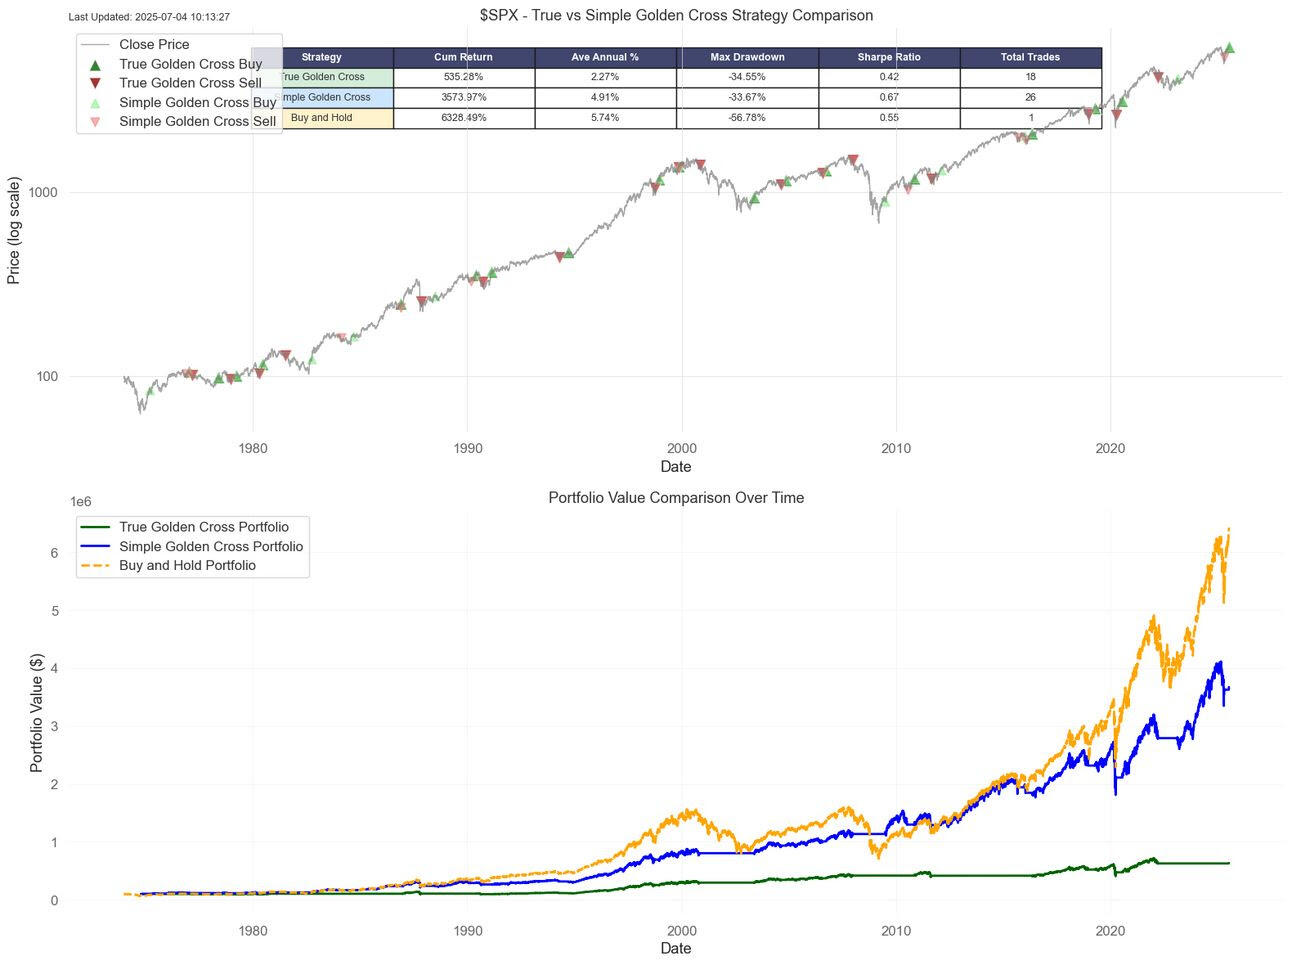
Before you think there is a bug in my code. Let me explain the difference. But before this is the beauty of code and math.
The most devastating missed trades
1. 1975-03-06 at $83.69—This was filtered because the 200-day MA wasn't rising yet. Missing this early entry meant losing 55 years of compounding from a very low price point.
2. 2009-06-23 at $895.10—This is the BIG ONE. This was the 2009 Financial Crisis recovery bottom. The market went from ~900 to over 4000+ in the following decade. Missing this single trade likely cost millions in portfolio value.
3. 2012-01-31 at $1312.41—Missing the continuation of the post-2008 bull market recovery.
4. 2023-02-02 at $4179.76—Missing the recent AI/tech rally that pushed markets to new highs.
The 2009 miss alone probably accounts for the majority of the performance difference. That single filtered trade represented entering at the start of an 11-year bull market with a portfolio worth hundreds of thousands of dollars. The "technical purity" of requiring both MAs to be rising filtered out some of the most profitable entries in market history.
This is a classic case of being technically right is not always right.
S2N observations
I am working on a bunch of things that are keeping my notes a bit briefer than usual.
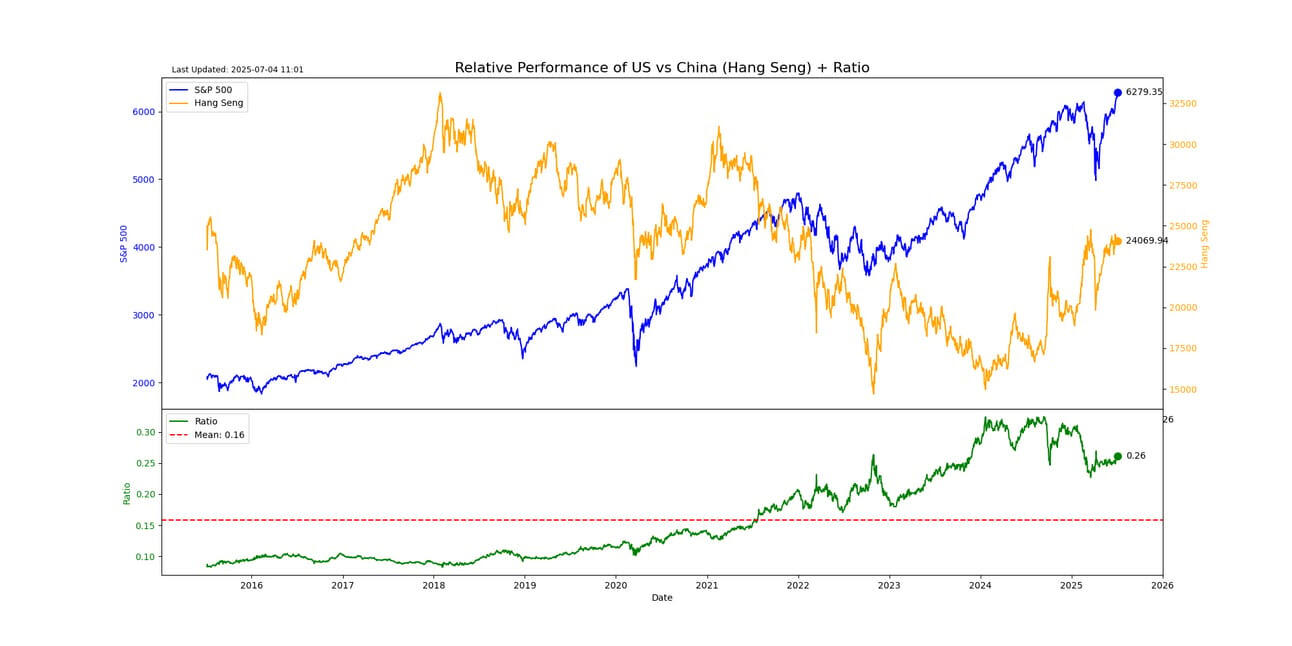
I still believe in shorting the US and being long China via the Hang Seng. Watch for the green line to drop to the mean.
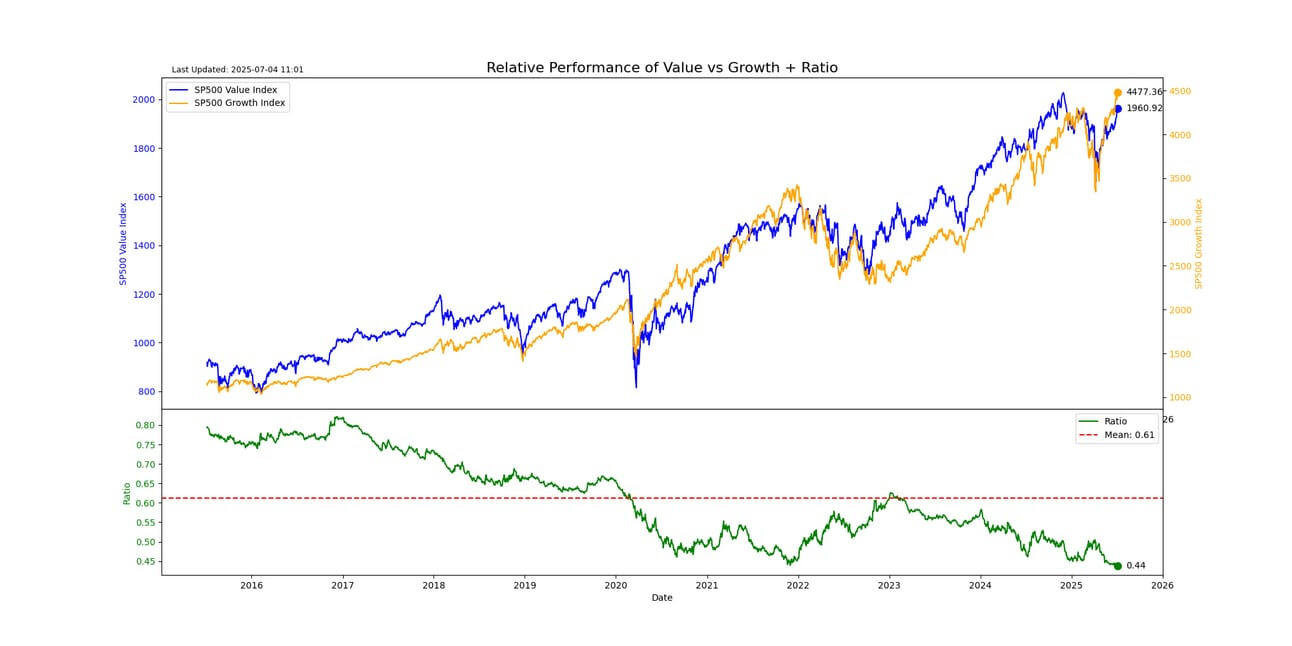
Another trade I favour is value over growth. I see the green line rising over the medium term. I will add some further analysis to this next week.
S2N screener alert
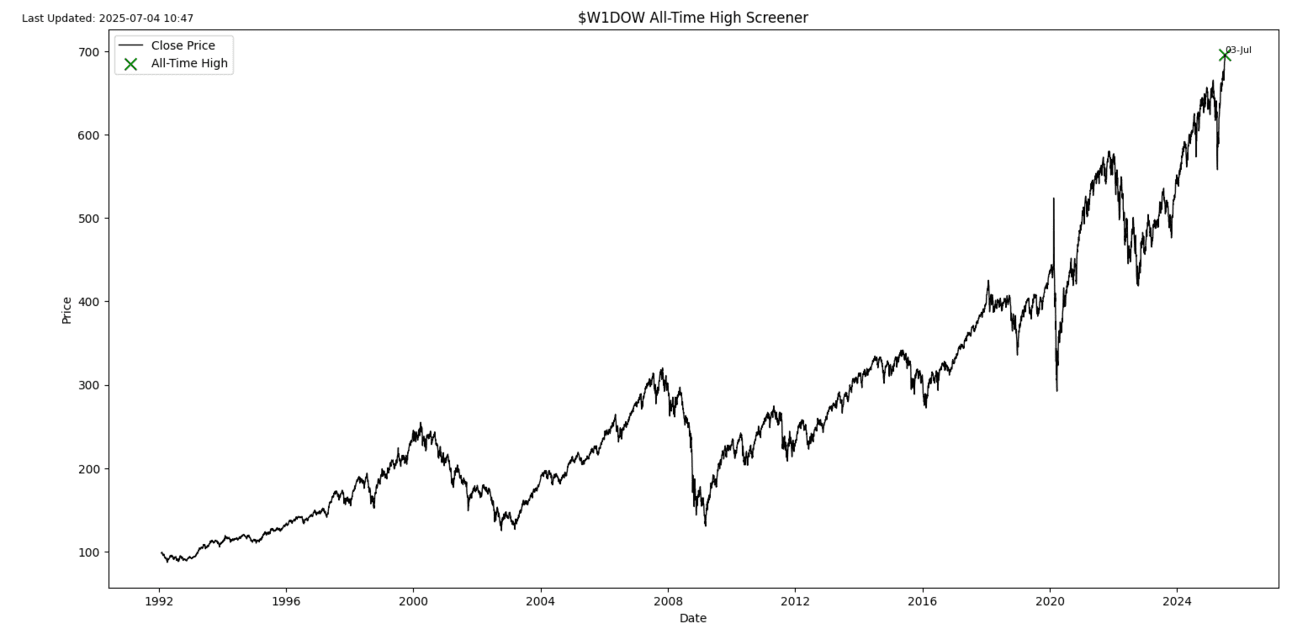
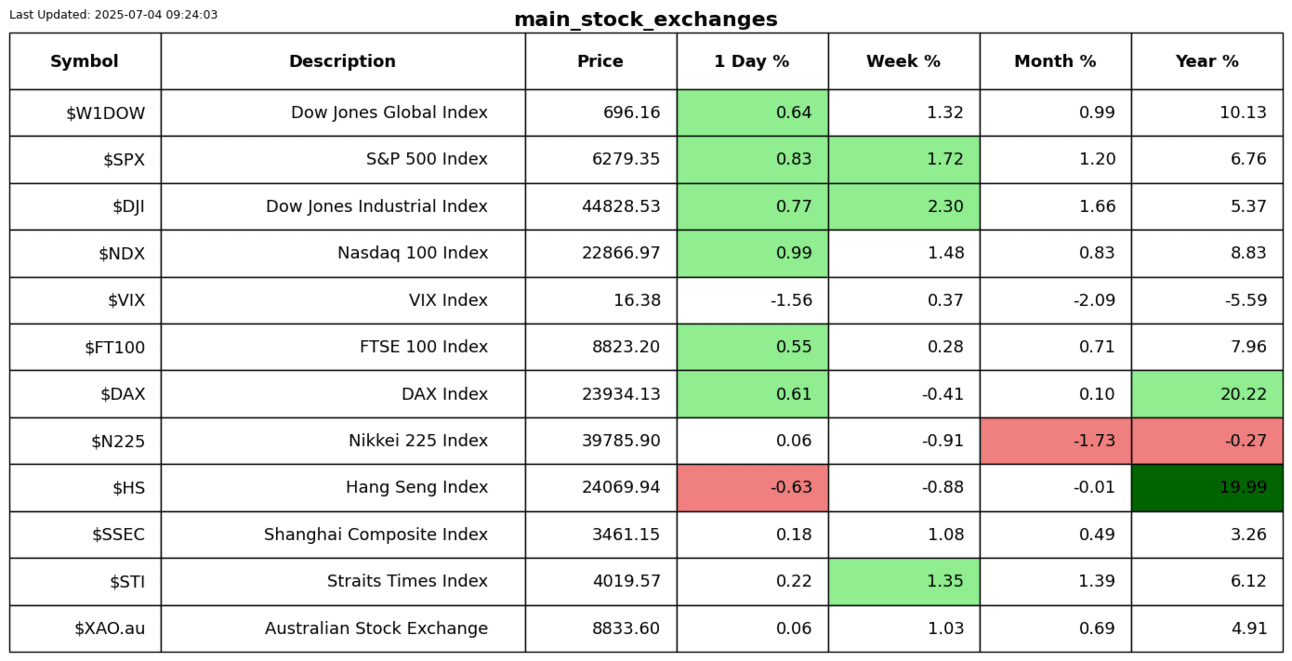
The Dow Jones Global Stock Index made another ATH.
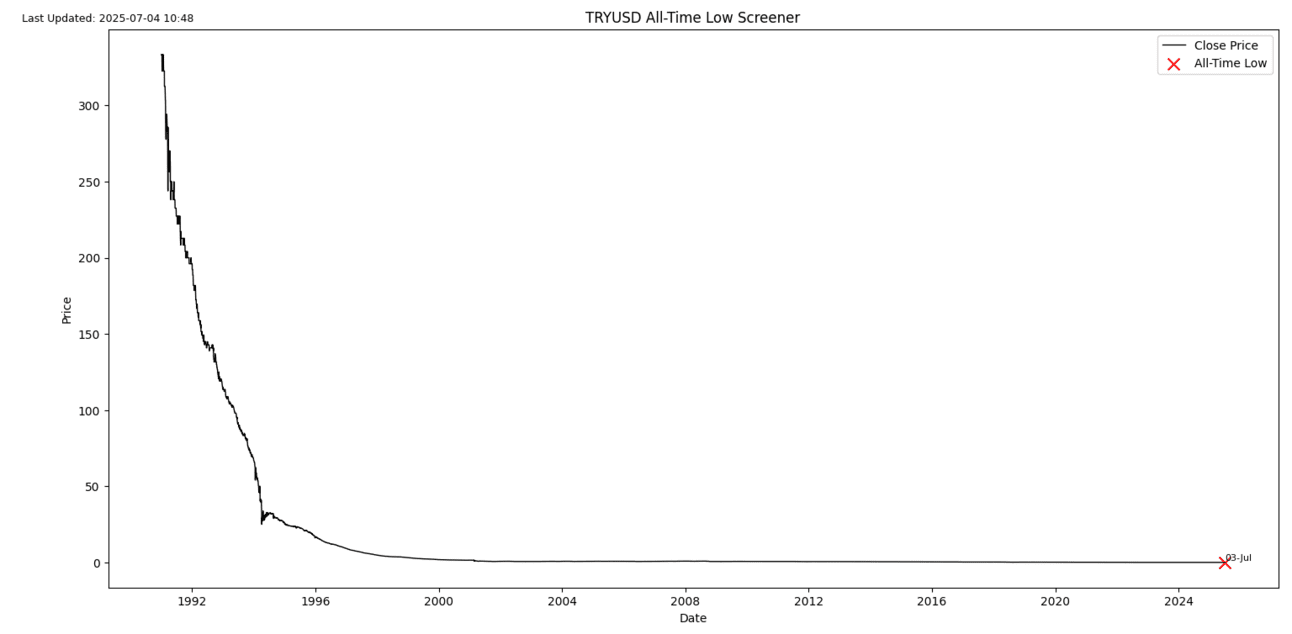
I honestly don’t know how Türkiye operates with a currency that is not worth the paper it is written on. Does this mean I can get a hair transplant at a good price?
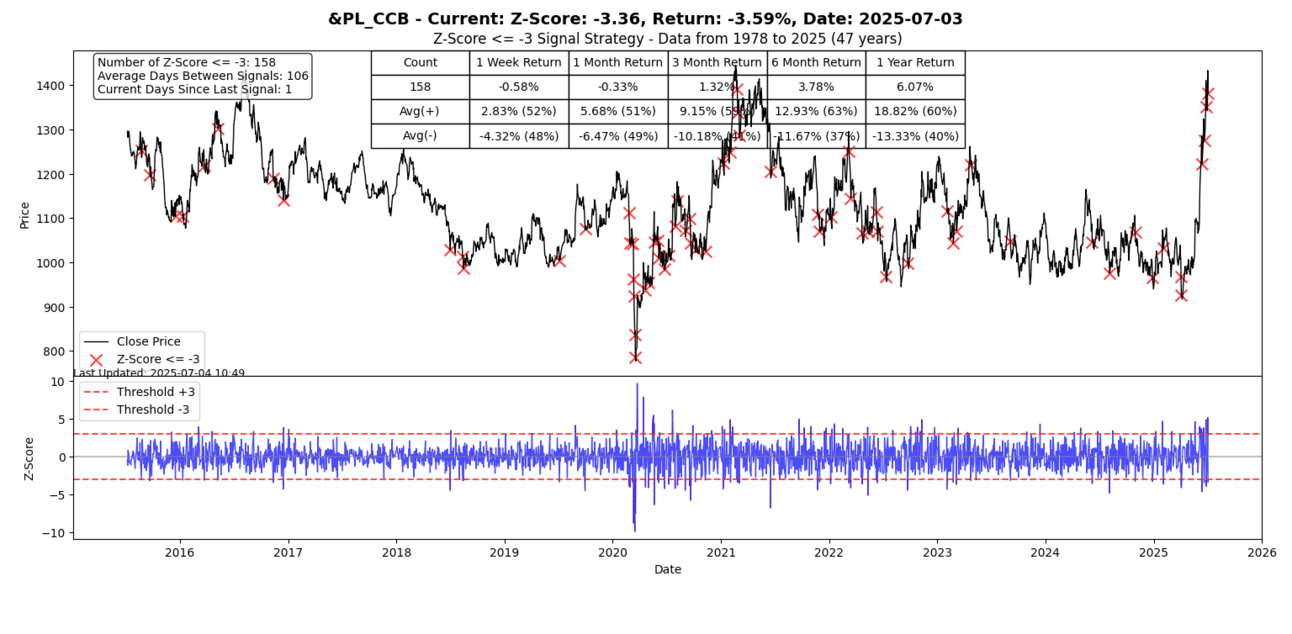
Riding this platinum wave up is like riding the most feared bull at the rodeo.
S2N performance review

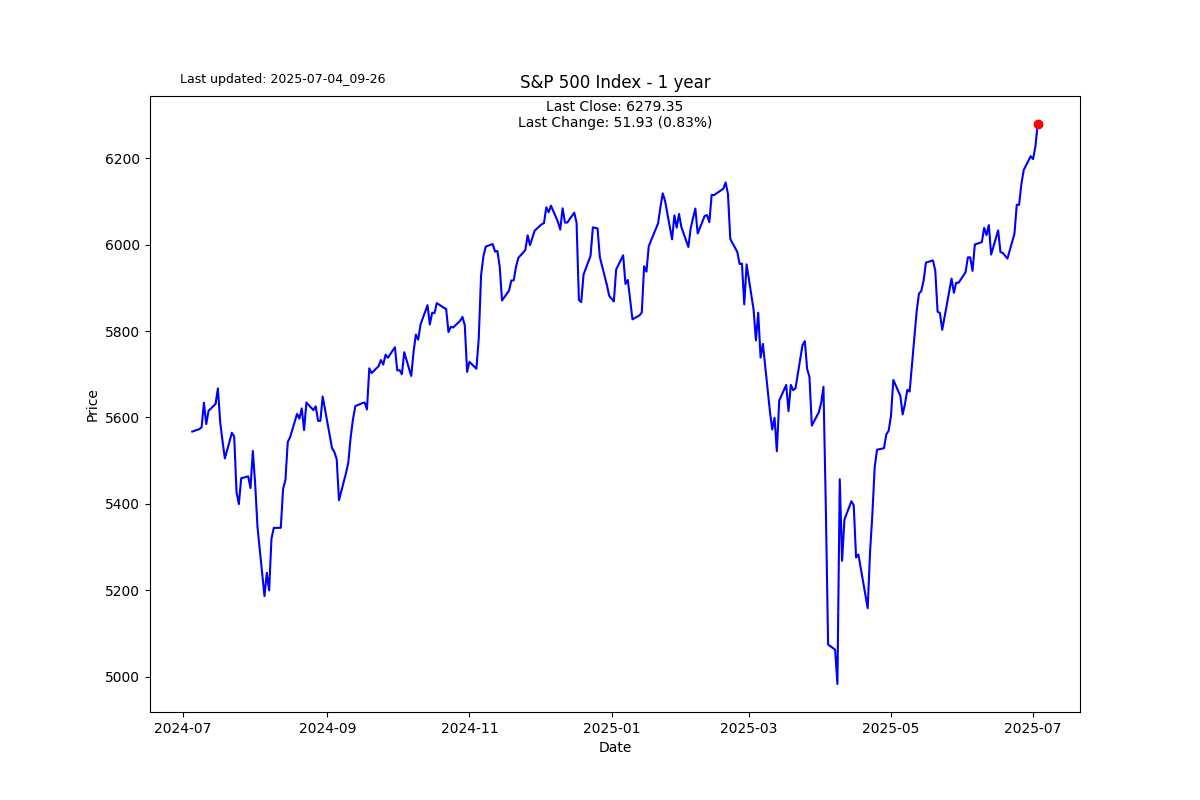
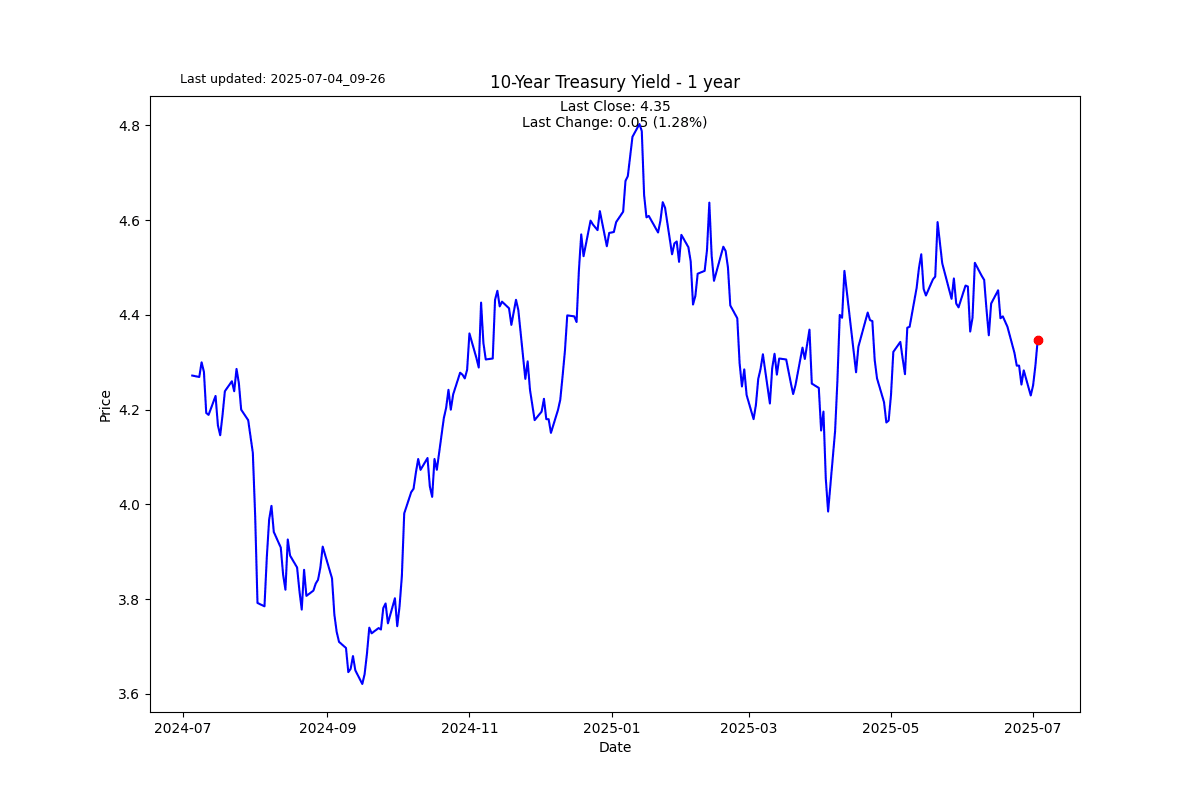
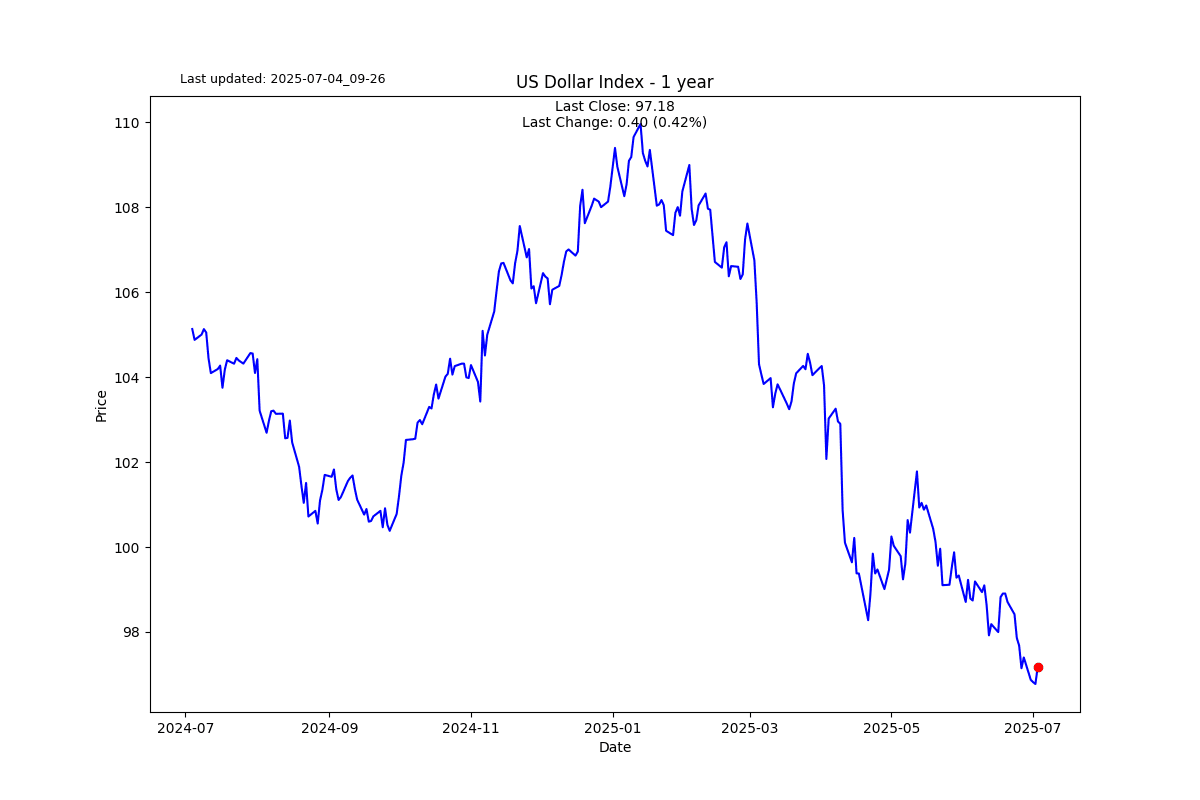
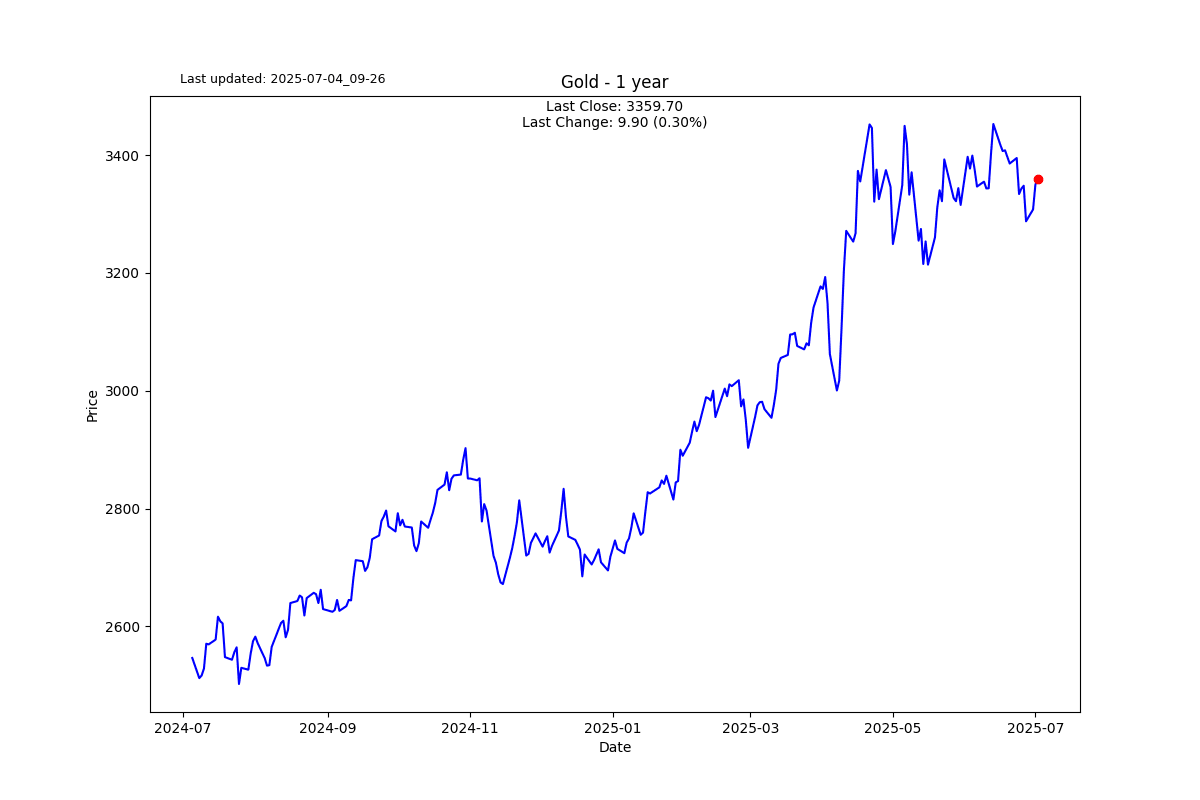
S2N chart gallery
S2N news today
Author

Michael Berman, PhD
Signal2Noise (S2N) News
Michael has decades of experience as a professional trader, hedge fund manager and incubator of emerging traders.


