Gold: Consolidation with the Eyes on New Highs

The Gold price backtracked on Tuesday after a volatile session driven by coronavirus worries and its impact on the global economy, which encouraged Gold's visit of the 2013's highs, at $1,683.38 per ounce.
From the Elliott wave perspective, Gold, in its 2-day chart, displays the advances of the precious metal in a wave (3) of Intermediate degree labeled in blue. This sequence began in August 2018 when the price found buyers at $1,160.32 per ounce.
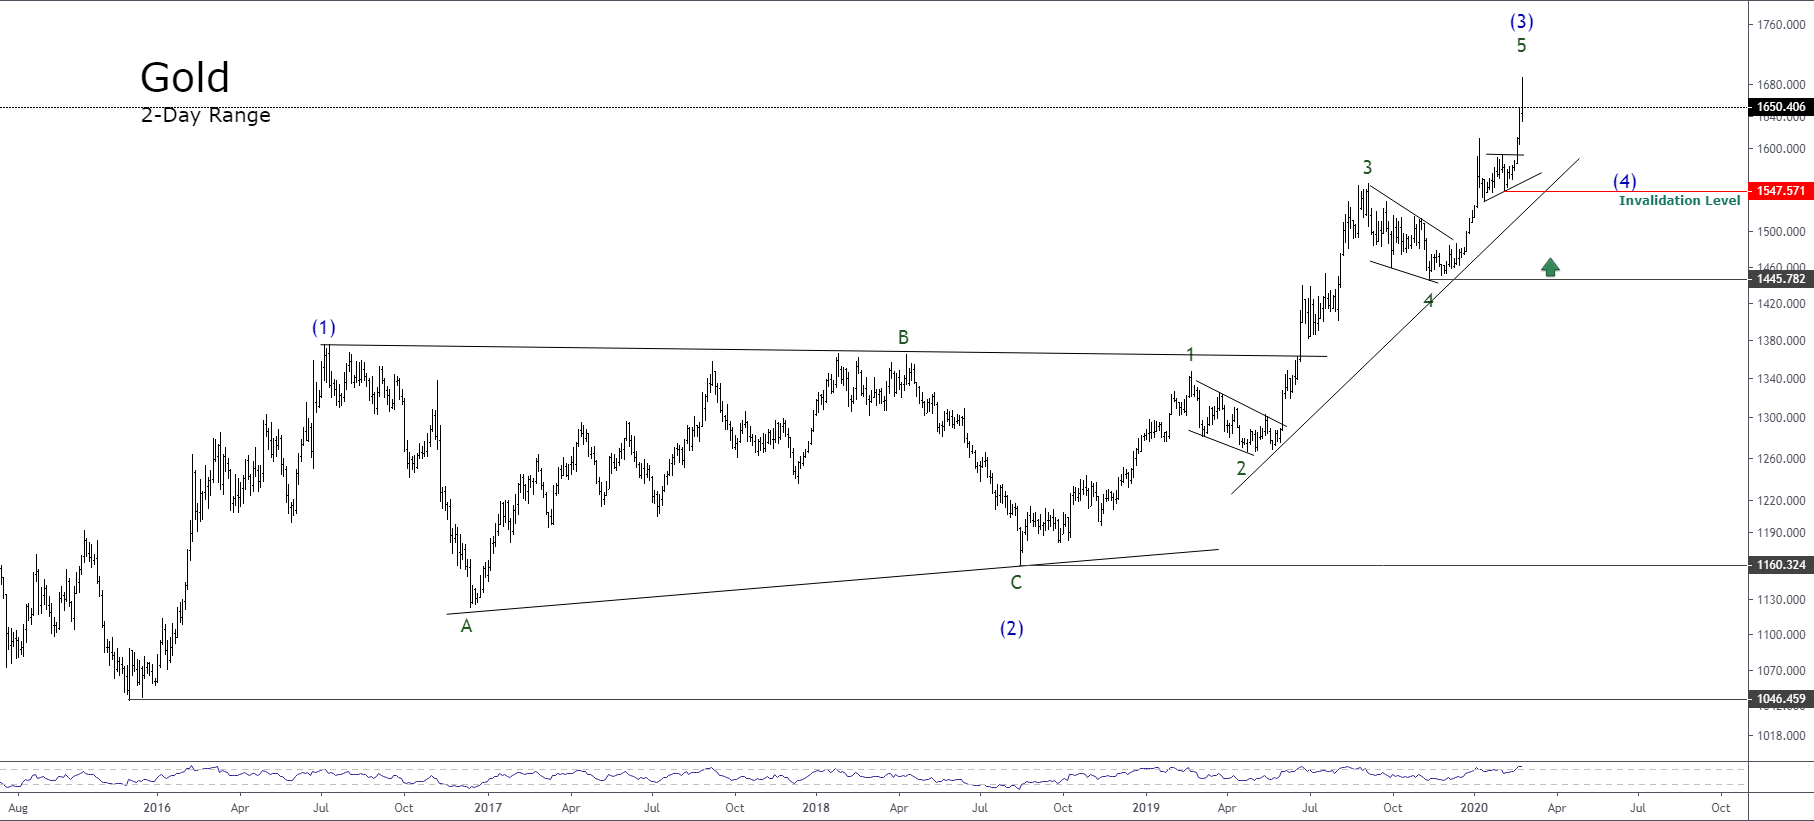
At the same time, the internal sequence of this bullish impulsive move in progress reveals that Gold advances in its fifth wave of Minor degree tagged in green, which started in the past October 2019 when price found support at $1,445.78 per ounce.
The next figure illustrates the yellow metal in its 12-hour timeframe. On that chart, we observe that price moves in its fifth wave of Minute degree labeled in black.
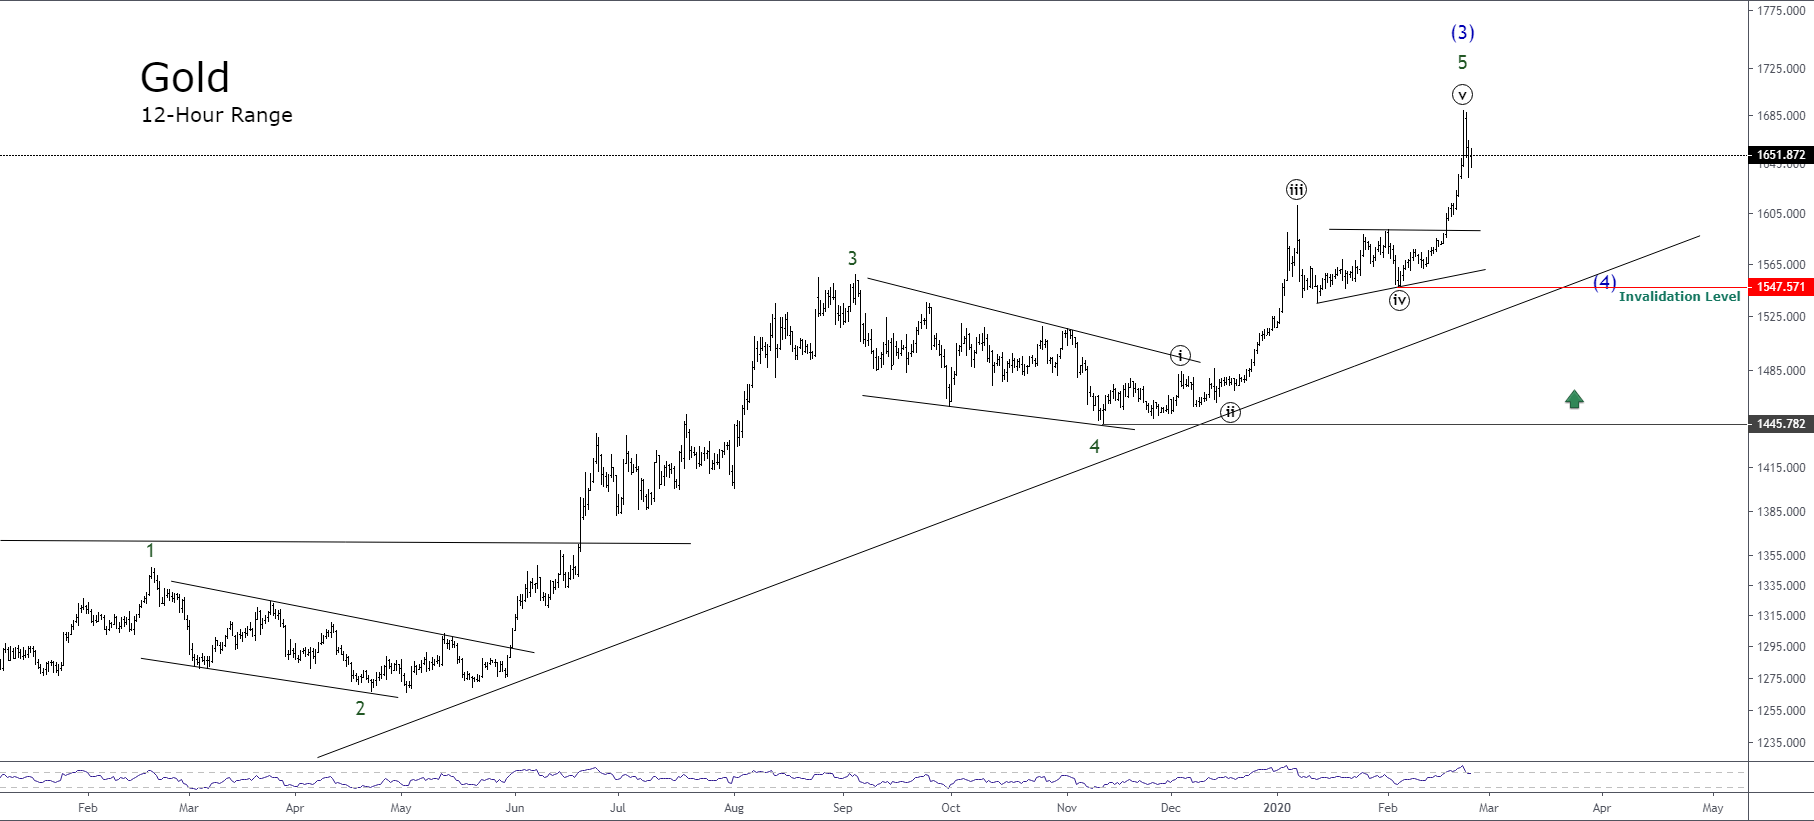
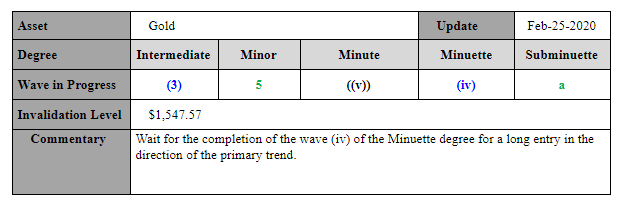
In the chart, we observe that the bias remains bullish. At the same time, the price action continues advancing above the invalidation level, settled at $1,547.57, which corresponds to the end of the fourth wave of Minor degree in black.
Gold, in its 4-hour chart, shows the price action starting the fourth wave of Minuette degree labeled in blue.
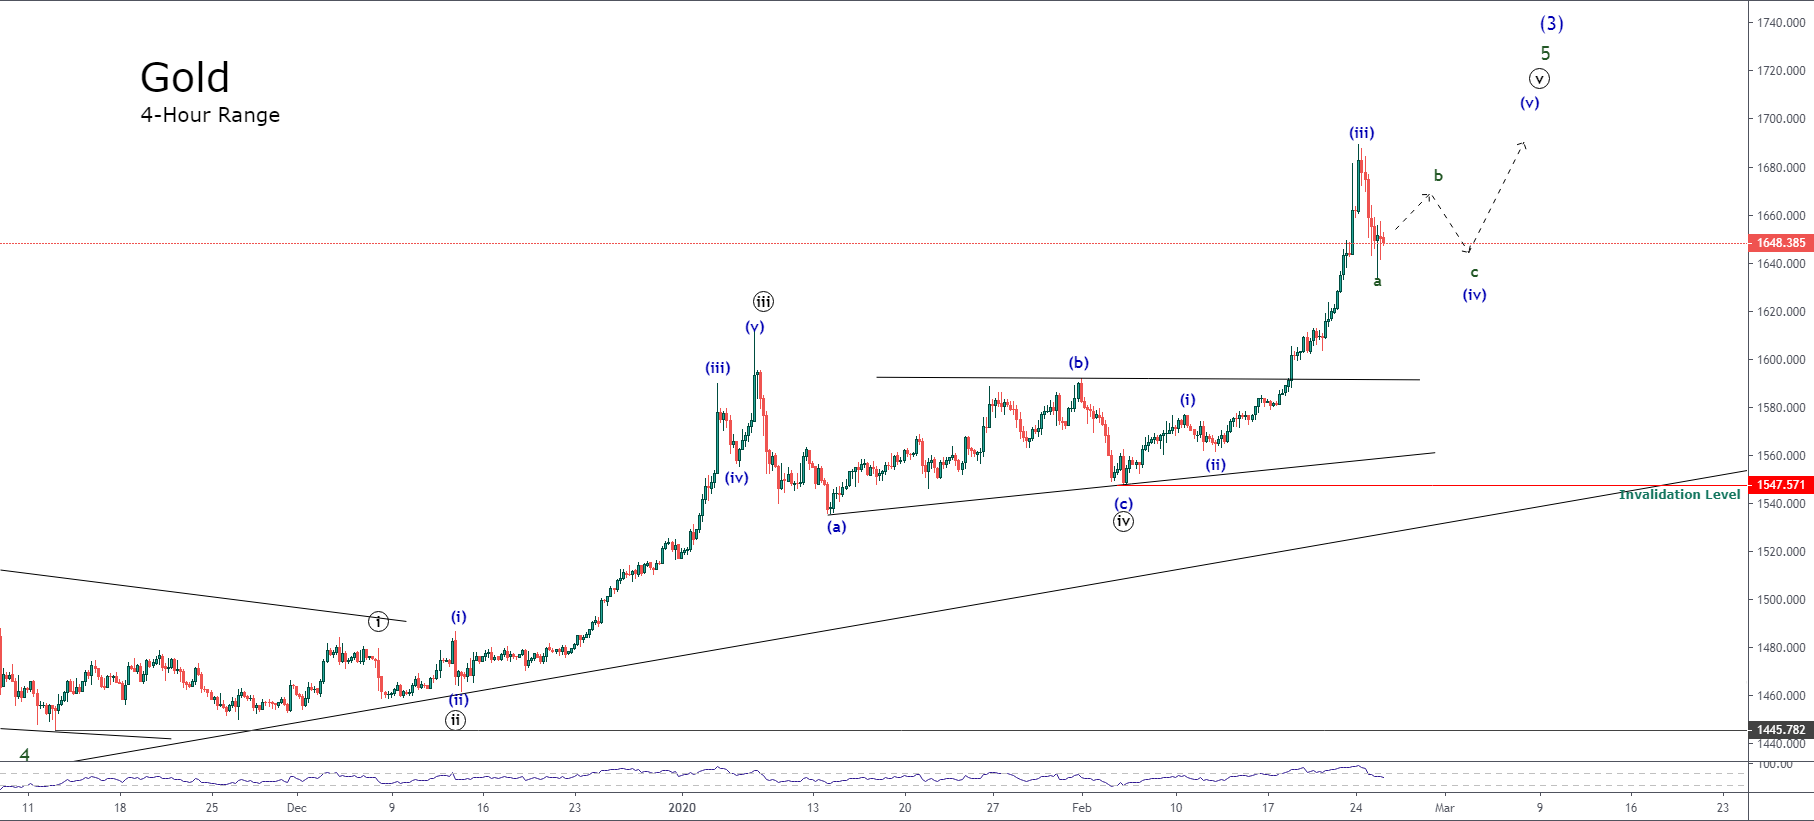
On the other hand, we observe that the third wave on the Minuette degree is an extended wave.
According to the Elliott wave theory, in an impulsive movement, there is only one extended wave; this rule makes us suspect that a new advance in a fifth wave shouldn't be extended. Therefore, the price could find resistance at the psychological level of $1,700 per ounce.
In conclusion, our preferred bias remains in the long side as long as Gold continues moving above $1,547.47 per ounce.
On the other hand, the possible next path that can develop the yellow metal is the completion of the fourth wave of Minuette degree in blue, which could provide a long-entry to profit from Gold's advancement to a new yearly high.
Elliott Wave Summary
Author

EagleFX Team
EagleFX
EagleFX Team is an international group of market analysts with skills in fundamental and technical analysis, applying several methods to assess the state and likelihood of price movements on Forex, Commodities, Indices, Metals and


