Gold, Chart of the Week: XAU/USD trapping longs for a significant squeeze ahead of key red-hot events
- Gold price bulls getting jammed in above the prior week's highs in the $1,920s.
- A phase of distribution could be on the cards with last week's highs a potential spring for the bears to lean against.

Gold price made the highest level since April while finding bids still above the psychological $1,900 level for a fifth-straight session on expectations that the Federal Reserve will ease off its hawkish stance on rate increase as inflation moderates, pressuring the US Dollar and US bond yields. The swaps market continues to price in an easing cycle by year-end
World interest rate probabilities, WIRP, suggest a 25 bp Federal Reserve hike on February 1 is fully priced in, with less than 10% odds of a larger 50 bp move. Another 25 bp hike March 22 is almost priced in, while one last 25 bp hike in the second quarter, Q2, is only about 30% priced in
However, as we head into the Federal Reserve's blackout period, there could be prospects of a significant correction for the days ahead, bar some range expansion and price discovery in this week's initial balance. We have red news on the calendar as well with this week's United States of America Personal Consumption and Expenditure as well as US Gross Domestic Product.
Analysts at TD Securities explained that ''Comex gold speculators notably added to their length as prices continued to rally to new local highs,'' but argue that ''the evidence continues to suggest that substantial Chinese buying activity may have overwhelmingly lifted prices over the last weeks.'' This too suggests we could be headed for a correction in the Gold price.
''Heading into the holidays, our tracking of Shanghai gold purchases has pointed to a slowing pace of accumulation since the start of China's behemoth buying activity in early November, with notable liquidations observed over the past few sessions,'' the analysts explained.
''The jury is still out on whether Chinese gold purchases will resume after the holidays, particularly from the official sector, but gold could struggle in the absence of Chinese buying activity without alternative buyers,'' the analysts concluded ahead of this week's business.
In last week's analysis, it was also noted that analysts at Brown Brothers Harriman have also of the opinion that the market is underestimating the potential for a higher for longer Federal Reserve. ''Core Personal Consumption Expenditures, PCE, has largely been in a 4.5-5.5% range since November 2021,'' they said. ''We think the Fed needs to see further improvement before even contemplating any sort of pivot.''
So, when we weigh up the prospects of a rethink along the curve and compare this to the recent price action and historic structures, as well as the timeline support/resistance areas, it would be reasonable to assume a corrective bias and start to plan for such as a tradable opportunity, as follows:
Gold price weekly chart
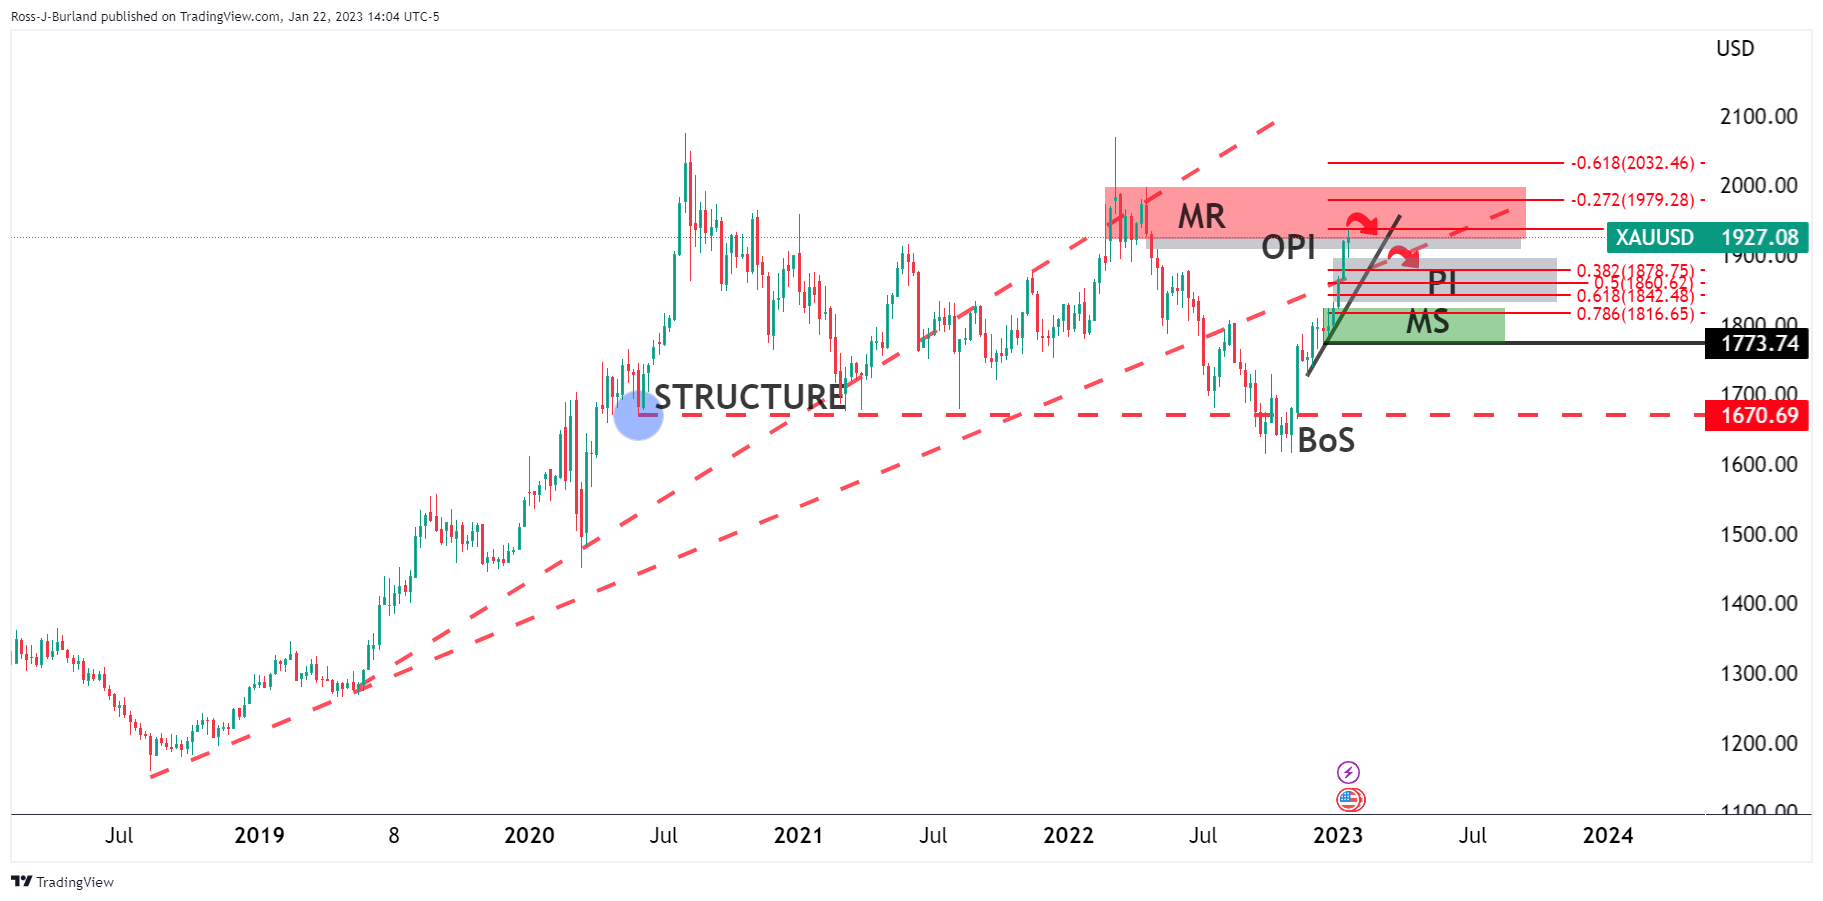
The Gold price rallied beyond the June 2022 and November 2021 highs triggering breakout traders, and those with wide stops remain in the money all the way into the old price imbalance (OPI).
Major resistance (MR) could now be in play as per the weekly Doji left in last week's close. The 38.2% Fibonacci retracement level around $1,878 could be an attractive area for a pullback that coincides with the price imbalance (PI) below as well as a reasonable area for where stops are placed that have been trailed higher by those targeting the breakout above the $1,870s.
Bears need to see a break of the current trendline support in order for the downside to play out to target major support (MS) near $1,820 and $1,770 that meets a 78.6% Fibonacci retracement.
If all of this were to play out over the coming weeks, the prior break of structure, (BoS) around 1670 could come back under pressure that guards against major downside correction.
Gold price H1 chart
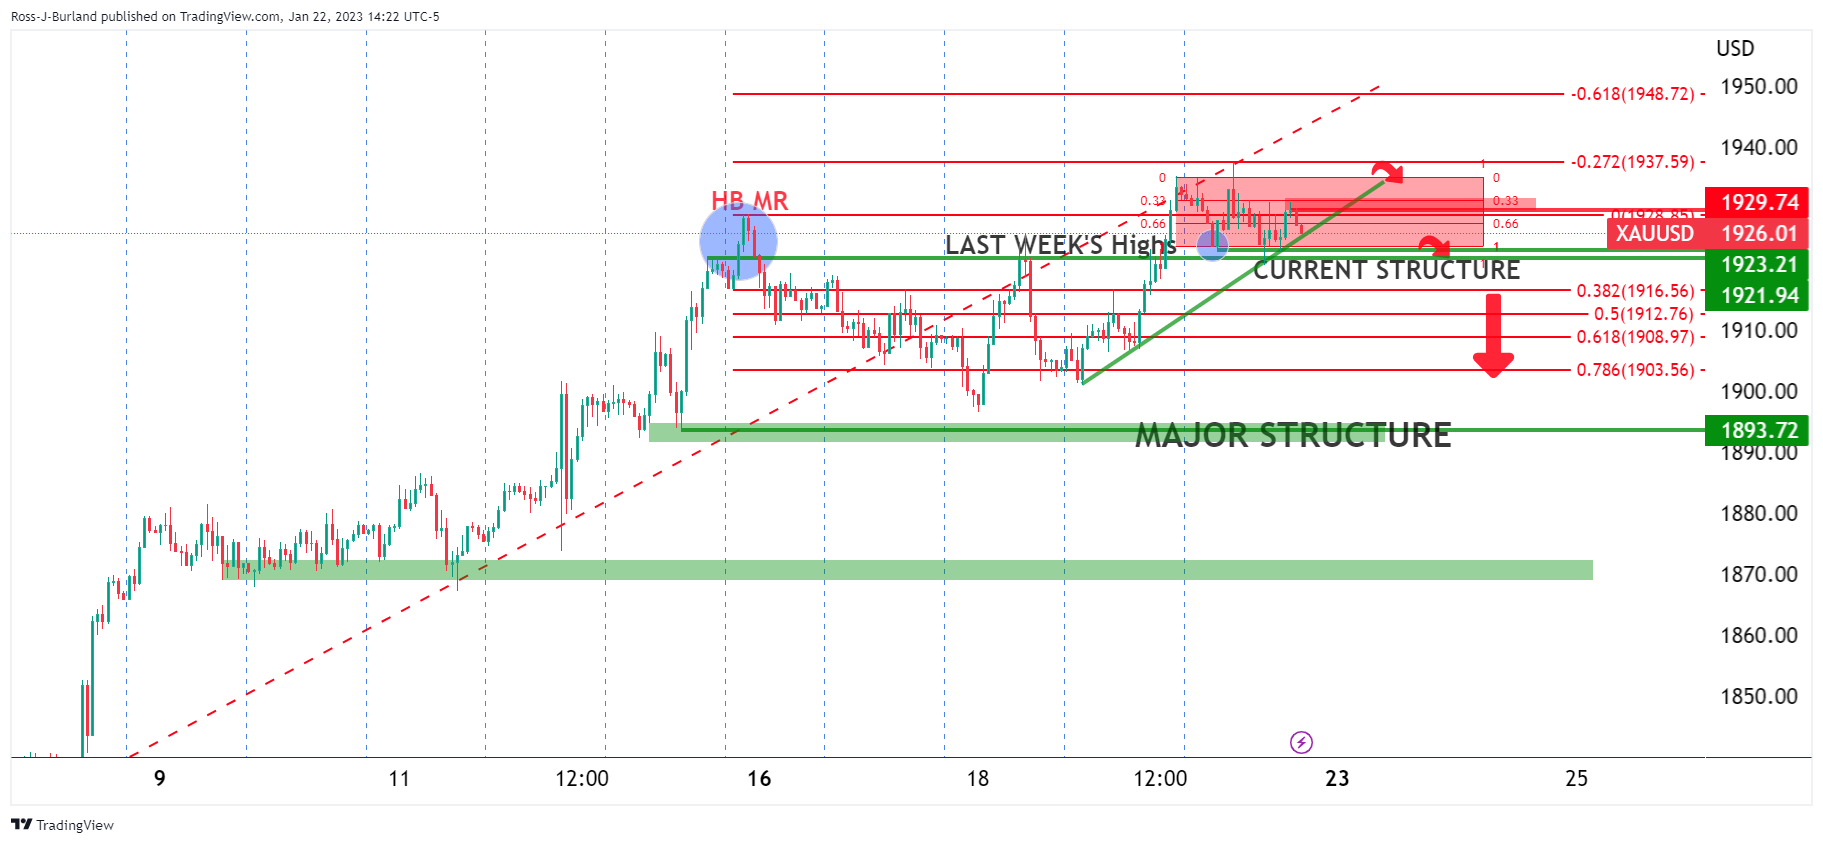
Meanwhile, from an hourly perspective, the above chart illustrates the current structure. Bears need to get below $1,923 and the dynamic trendline support. We could be seeing trapped bulls in this current consolidation as the market eats into the high bull major resistance set at the start of last week in a topping formation, (head and shoulders). This is all occurring above the prior week's highs, pulling in breakout traders. A phase of distribution could be on the cards with last week's highs a potential spring for the bear to lean against, as shorts emerge from a premium, in the $1,920/30s.
Premium
You have reached your limit of 3 free articles for this month.
Start your subscription and get access to all our original articles.
Author

Ross J Burland
FXStreet
Ross J Burland, born in England, UK, is a sportsman at heart. He played Rugby and Judo for his county, Kent and the South East of England Rugby team.


