Gold, Chart of the Week: XAU/USD its make or break time
- Gold is at a crossroads as we head into the Fed this week.
- The bears are lurking below a critical technical structure with price below trendline resistance.

Gold closed within last week's range on Friday, firmly back into the hands of the bears as the US dollar hung on into bullish territory despite declining for the second straight week, pressured by growing expectations that the Federal Reserve will turn less aggressive soon. Gold ended at $1,644.38, down some 1.14% falling from a high of $1,667.11 and falling to a low of $1,638.12. The DXY index, which measures the greenback v.s a basket of currencies fell to a low of 110.288 and backed up again from key trendline support, thus will it remain vulnerable to the risk events ahead this week.
The Federal Open Market Committee is expected to deliver a fourth consecutive 75bp rate hike next week where it might want to bring policy to a level at which whereby it will be shifting to a steadier hiking pace. However, the hot US Consumer Price Index will likely keep the fire burning at the Fed. The focus will be on the press conference where guidance for future increases could move the needle and after four jumbo-sized hikes, the chairman, Jerome Powell, may want to gauge economic responses before committing to anything besides hiking rates in the face of market speculating that the Fed would slow the pace of rate hikes amid concerns about overtightening. Meanwhile, the greenback jumped 0.8% on Thursday after data showed that the US economy expanded 2.6% YoY in the third quarter, exceeding forecasts for a 2.4% growth and rebounding from two consecutive quarters of economic contraction.
Money managers have aggressively covered their short gold exposure, as talk of a Fed pivot drove rates and the greenback lower but the data of late put gold back into reverse. Moreover, as analysts at TD Securities explained, ''despite the price moving higher and markets musing about inflation turning lower in the not too distant future and hoping the US central bank would sharply reduce the pace of tightening, long exposure did not increase one bit.''
''This suggests to us that while traders don’t see rates accelerating much beyond what is currently priced, at the same time they don’t see a dovish tilt anytime soon. Indeed, gold prices are likely to head lower.''
Gold & DXY chart
Moving to the charts, first looking to the US dollar, its all or nothing this week:
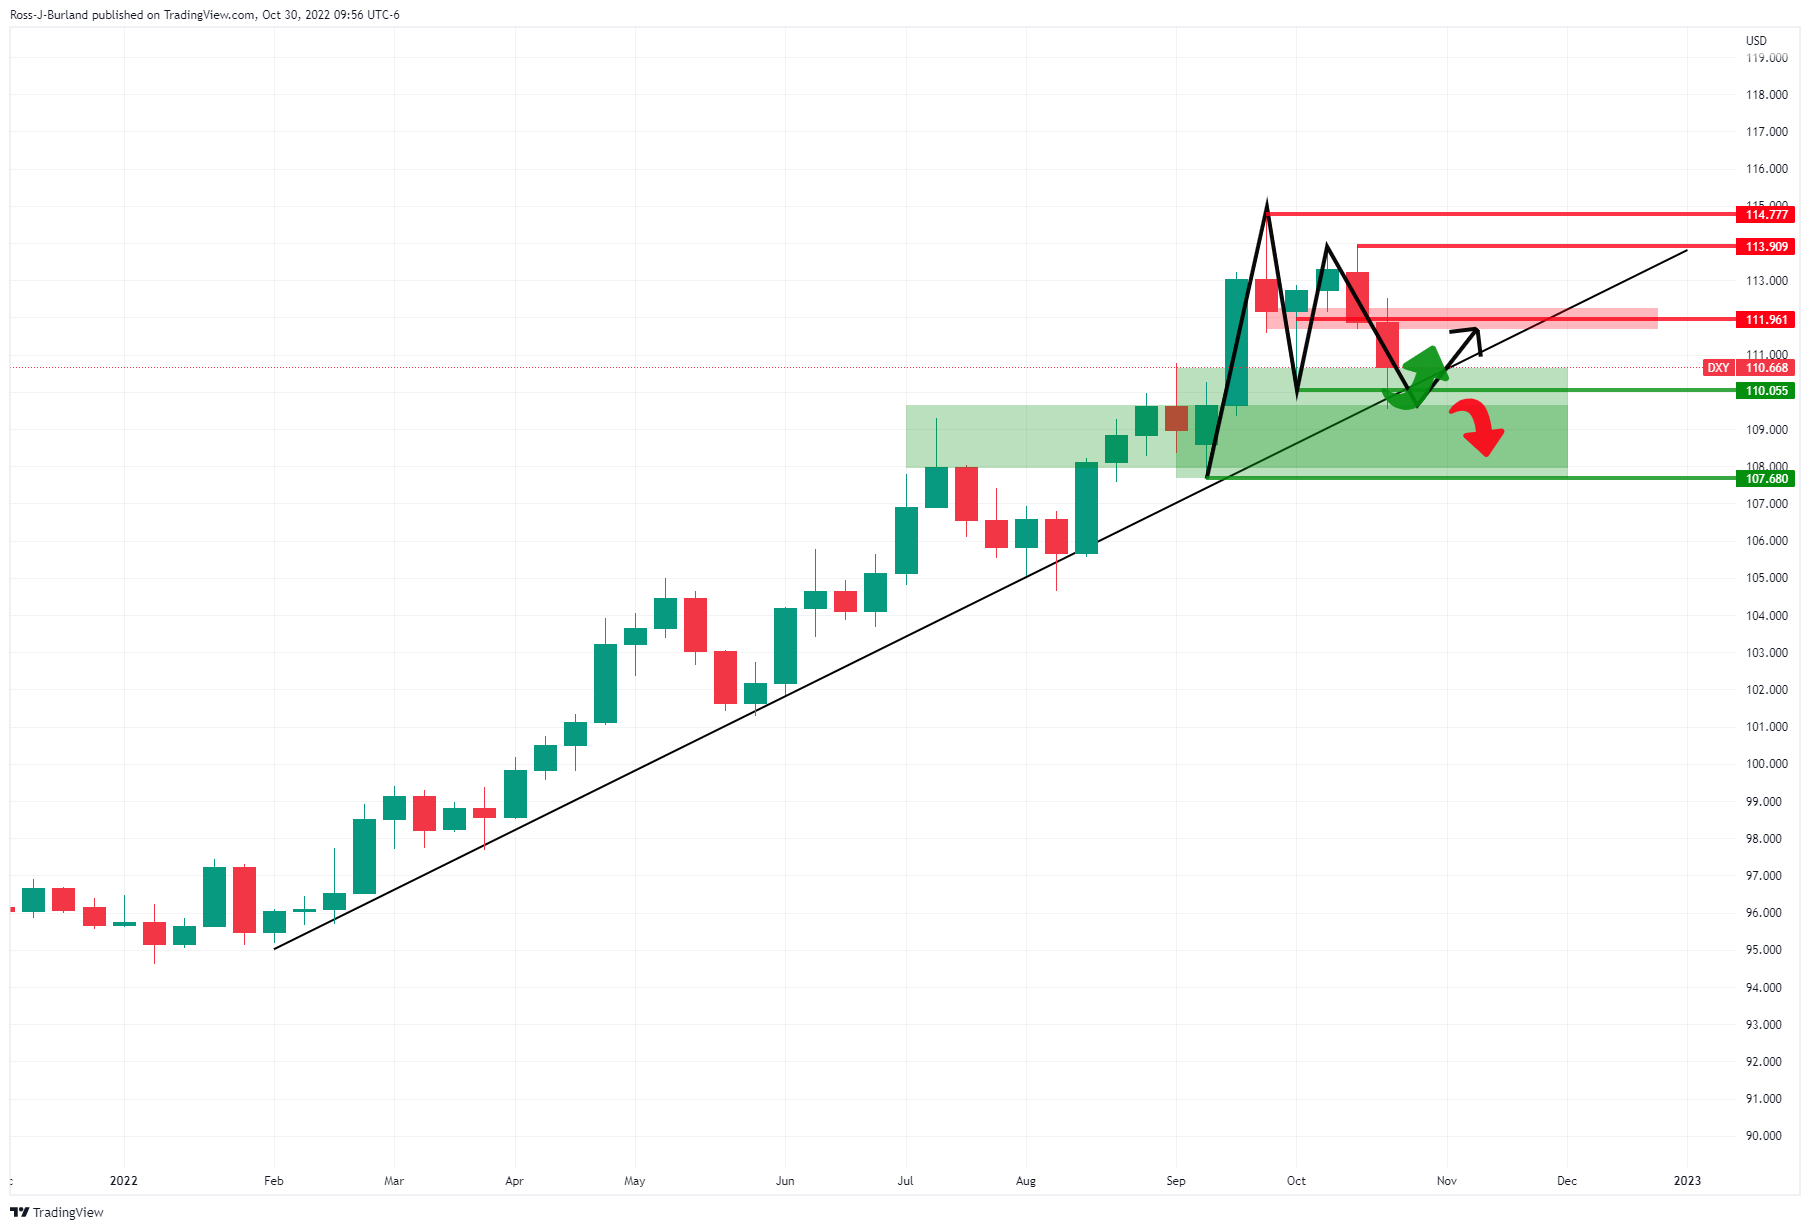
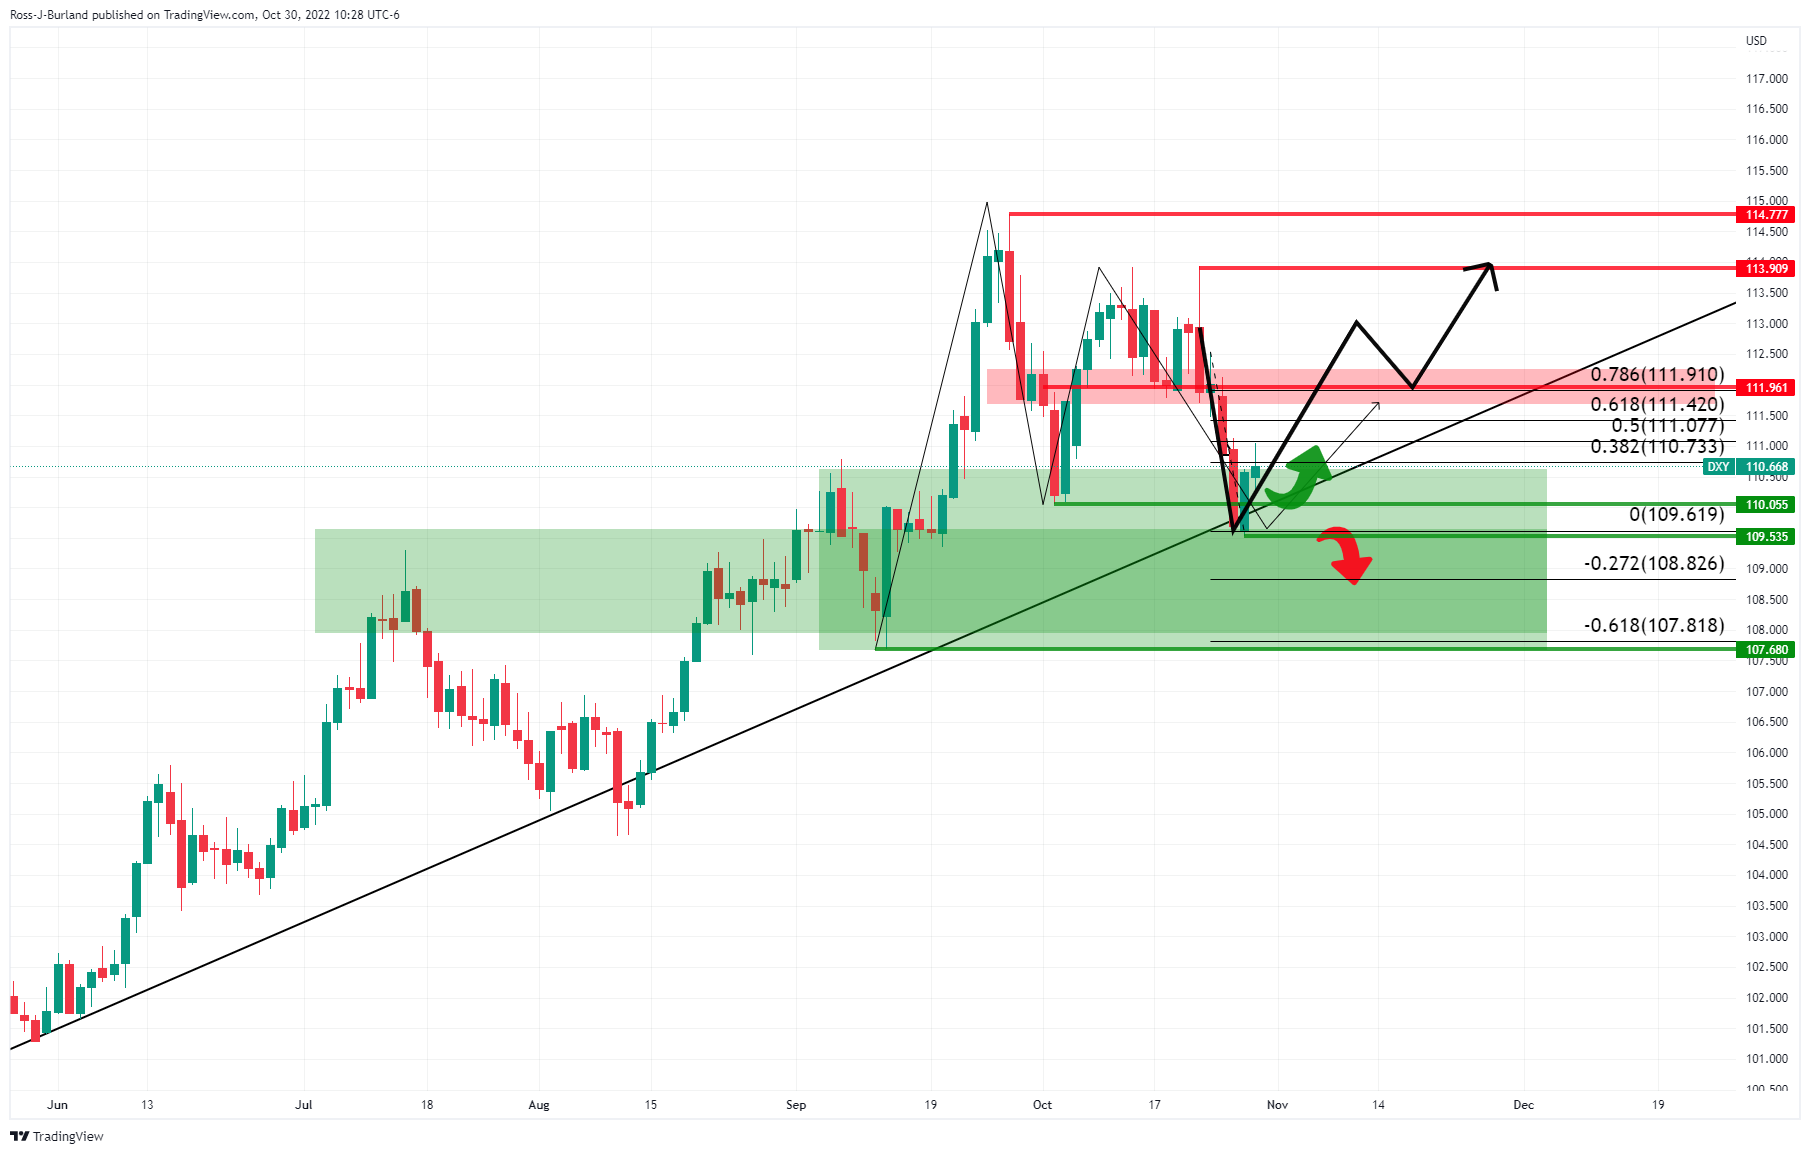
The price, as per the W-formation on the weekly chart, could be still in its evolution in terms of the downside with room to go to test between 107.70s and the 109.50s. However, for now, the index is being rejected from familiar trendline support and if we zoom down to the daily chart, the rejection is powerful which may mean there is more to come from the bulls in the days leading into the Fed. A break of 112.00 could be significant in this respect:
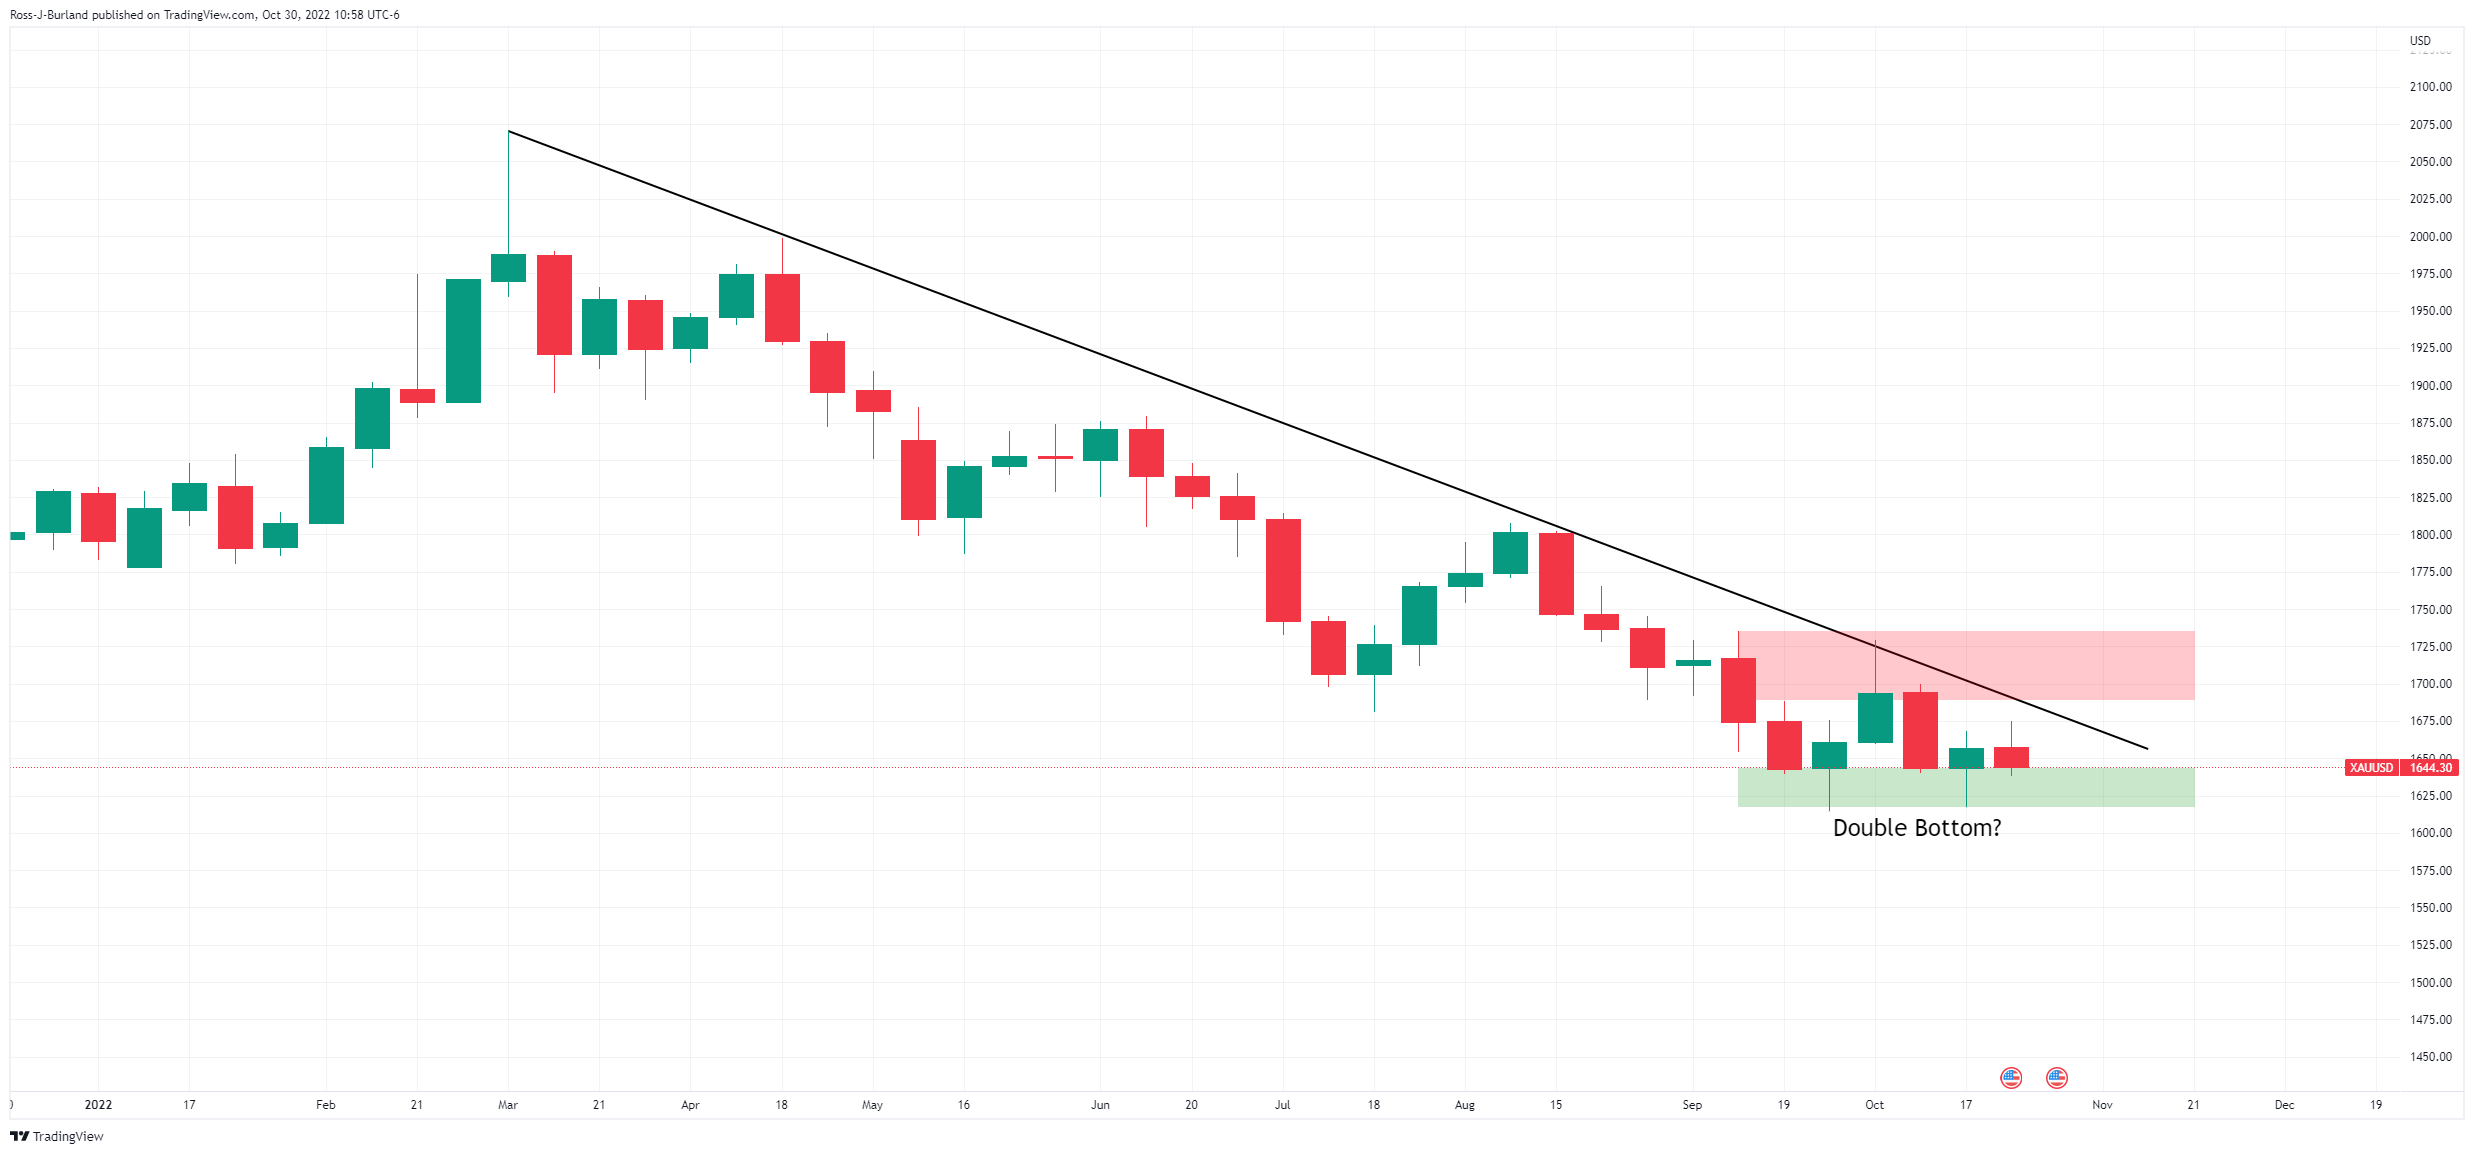
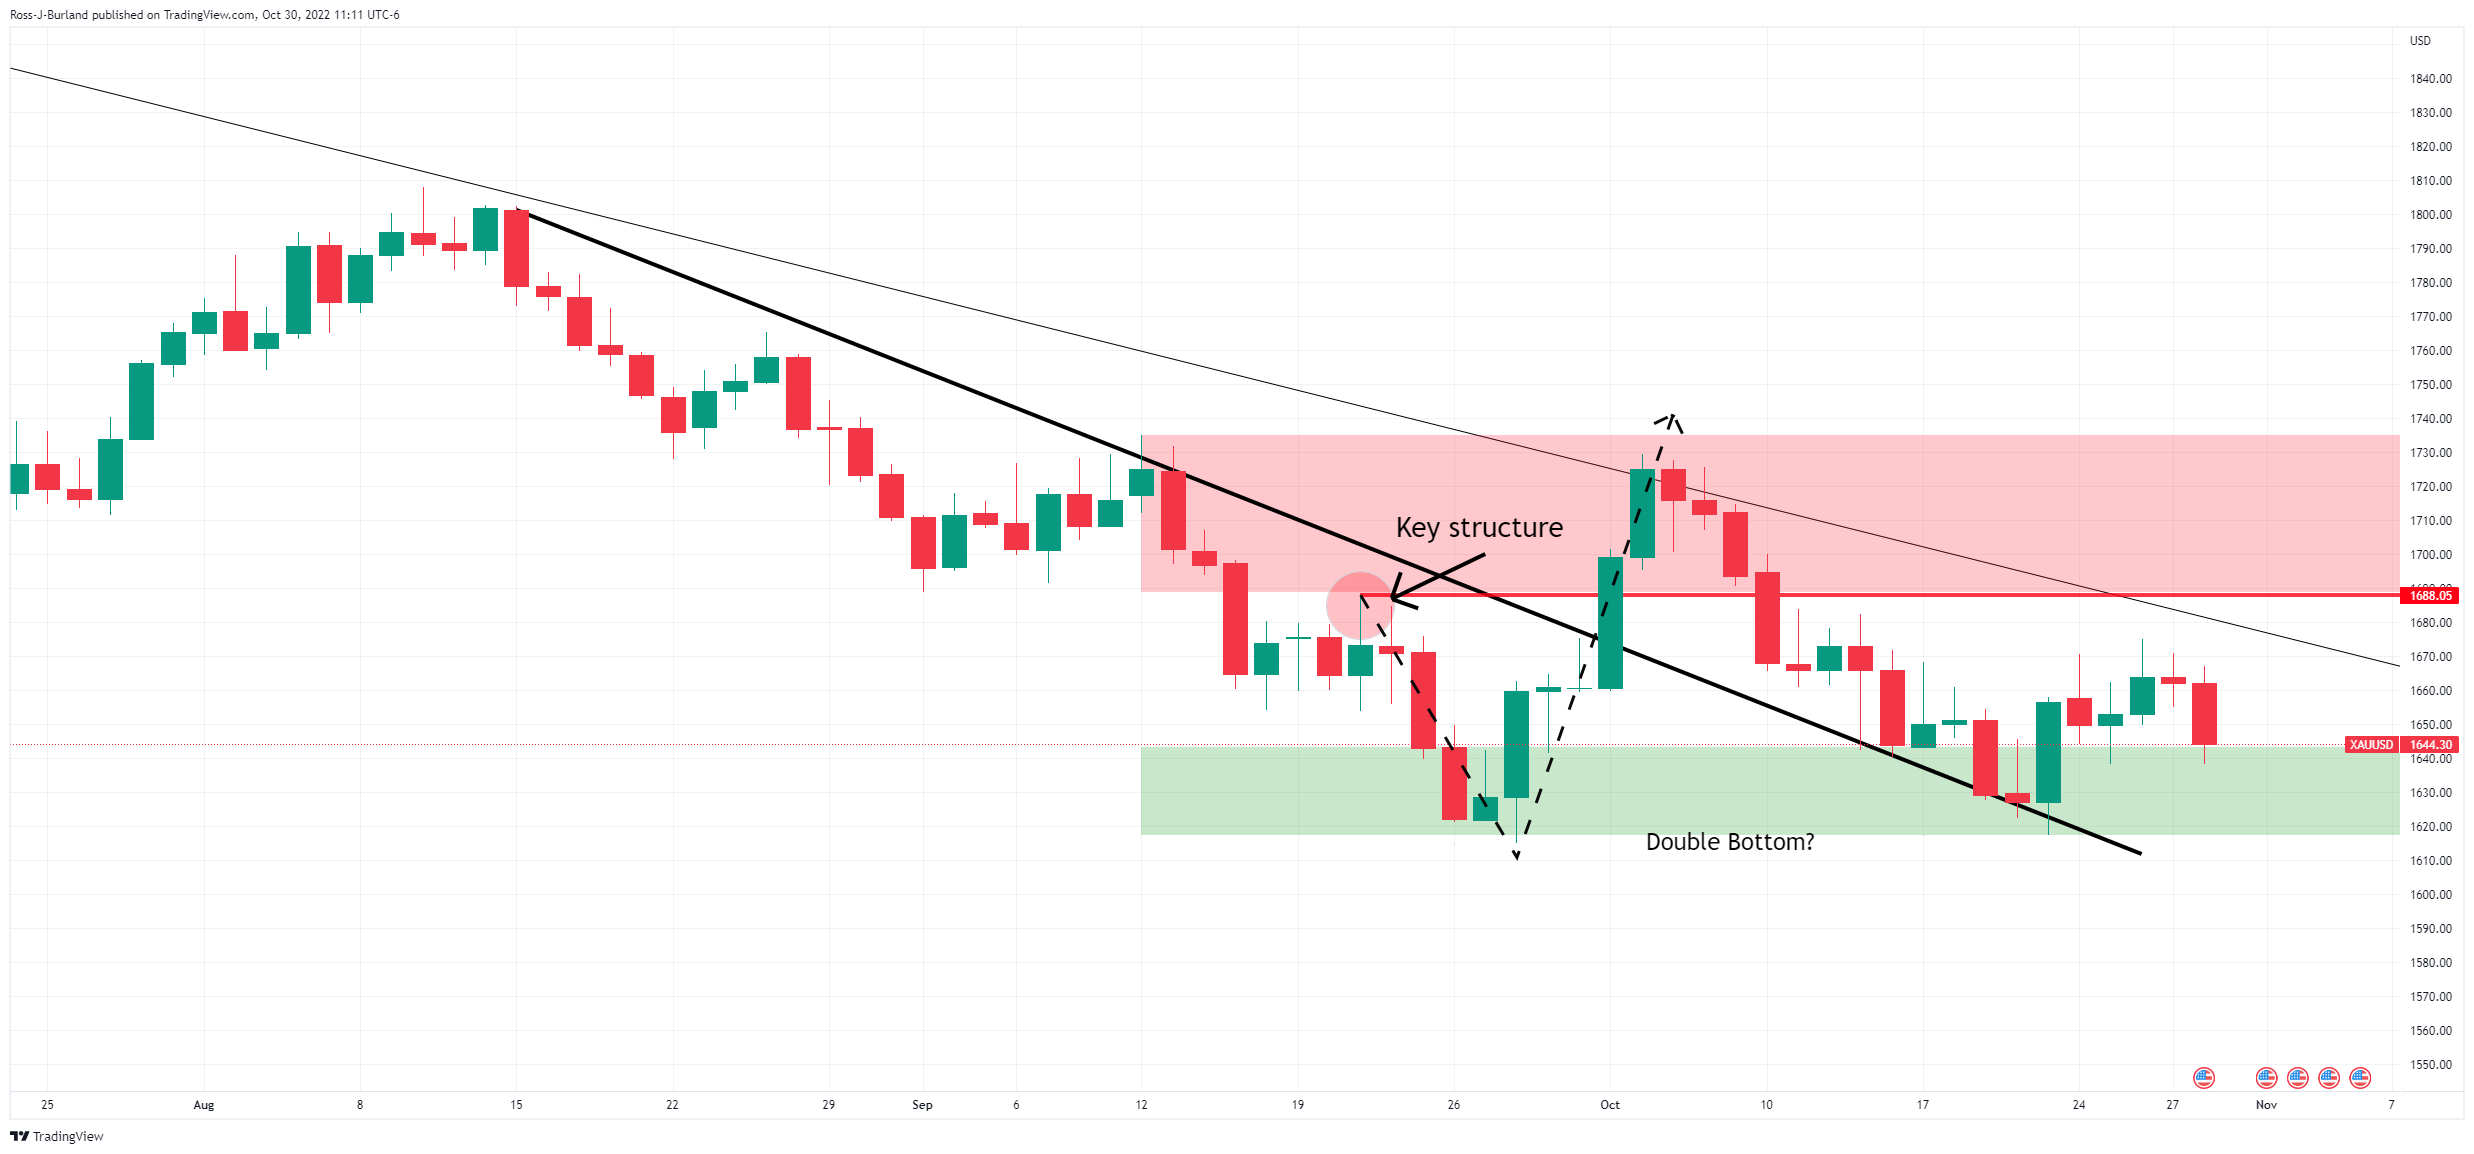
Moving back to gold, a close below Friday's low will be troublesome for the committed bulls while below the weekly trendline resistance, despite what could be a double bottom:
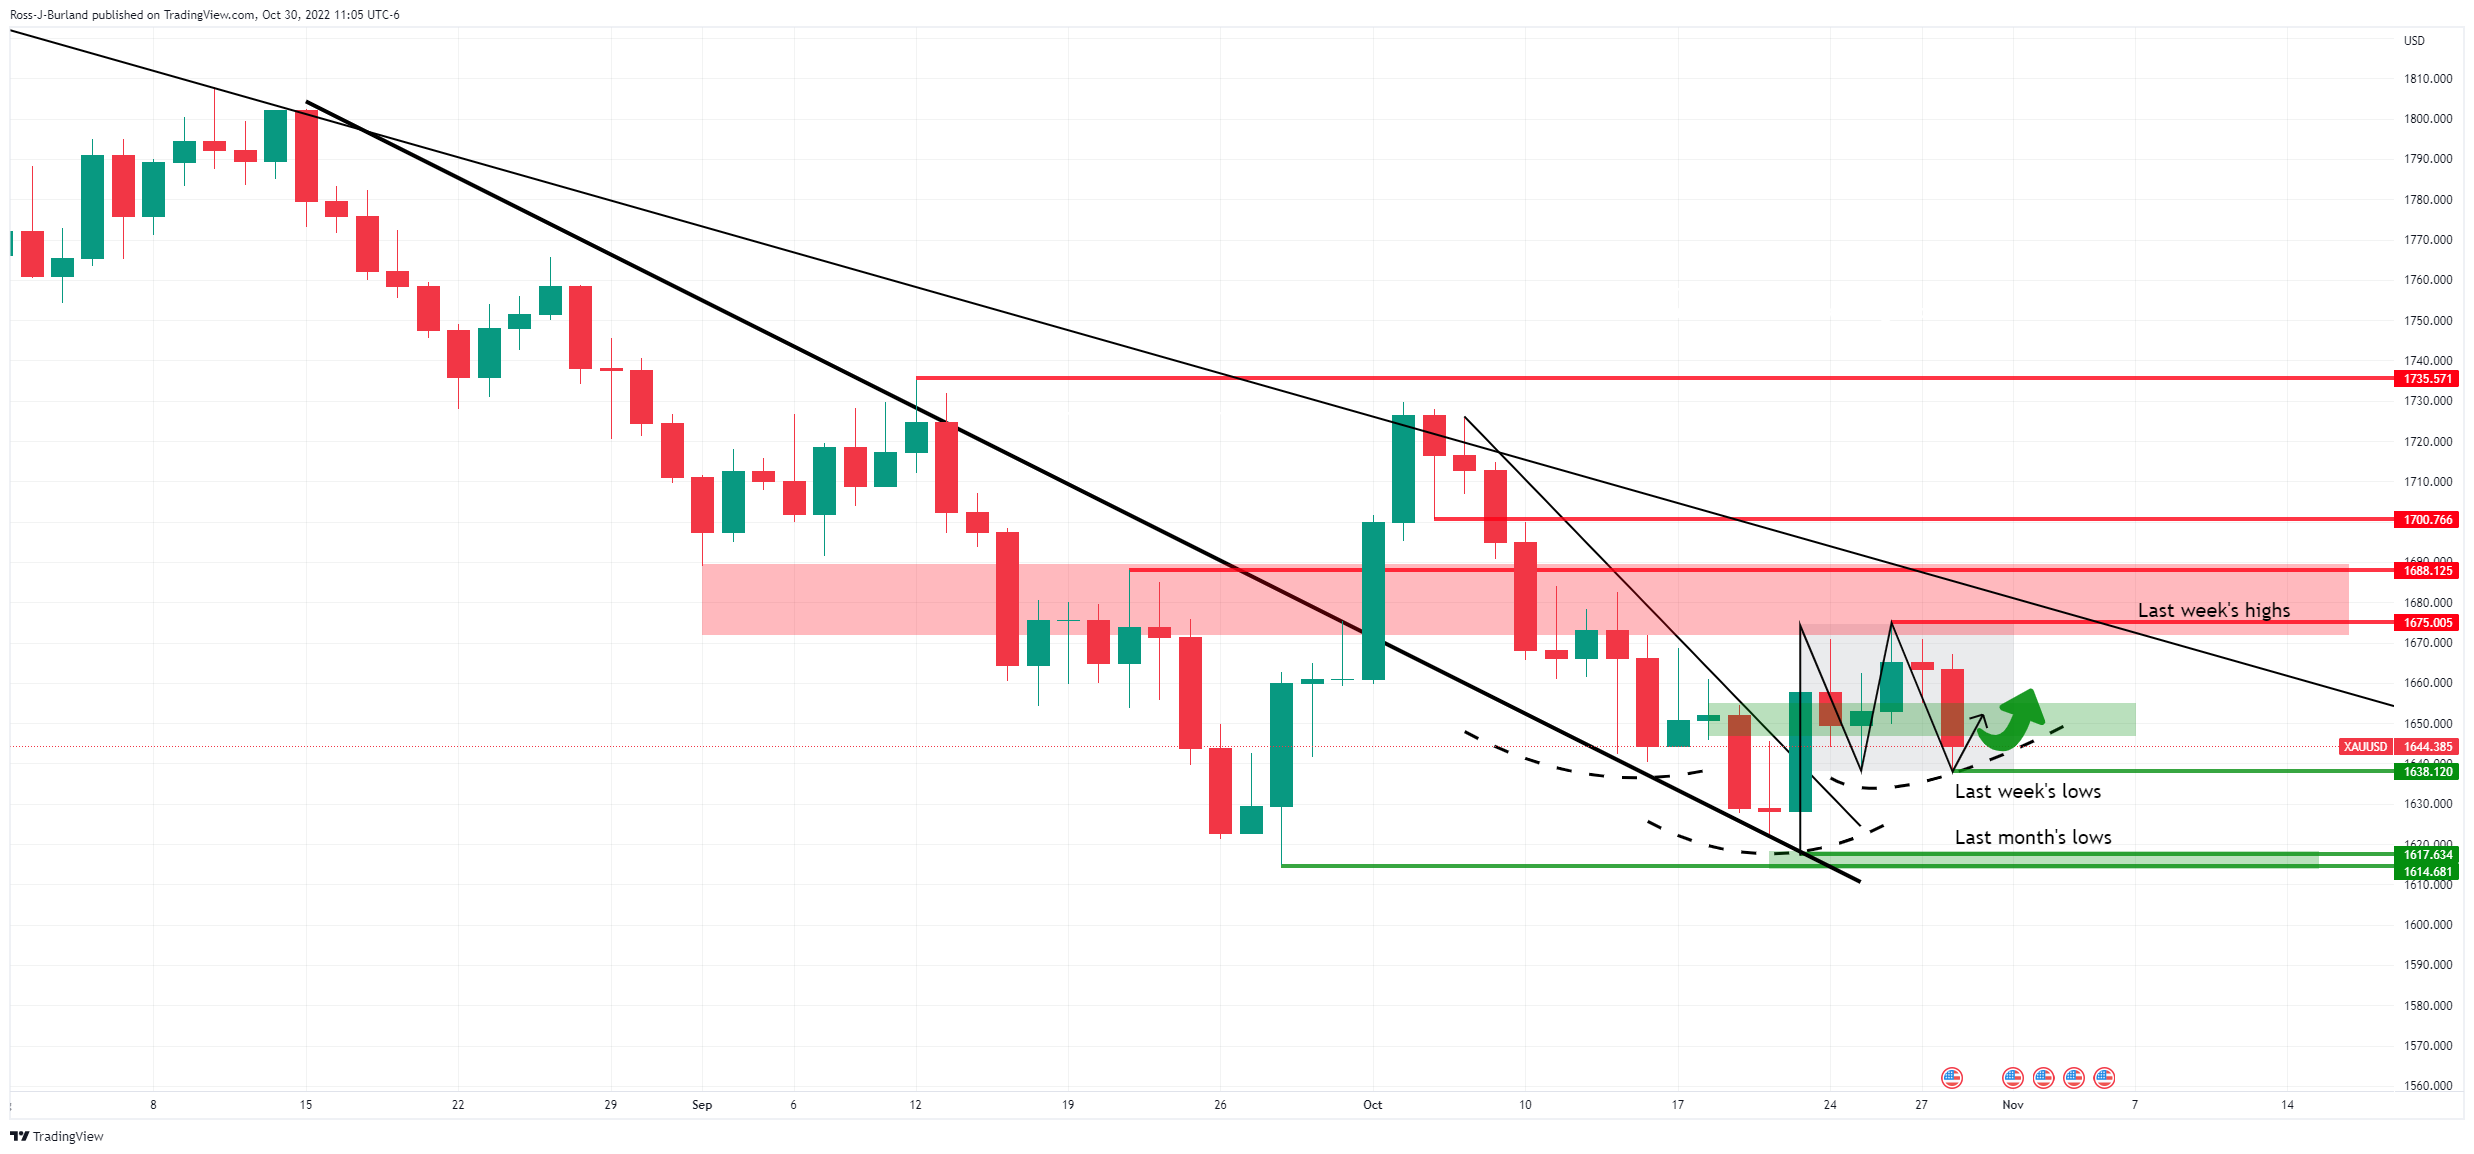
On the daily chart, the M-formation might only be in its early stages of development, but nonetheless, it's there and the price could move beyond last week's highs of $1,675 which could potentially signify that the inverse head and shoulders are in play. This will leave a focus on a break of the trendline resistance and then a critical structure of $1,688:
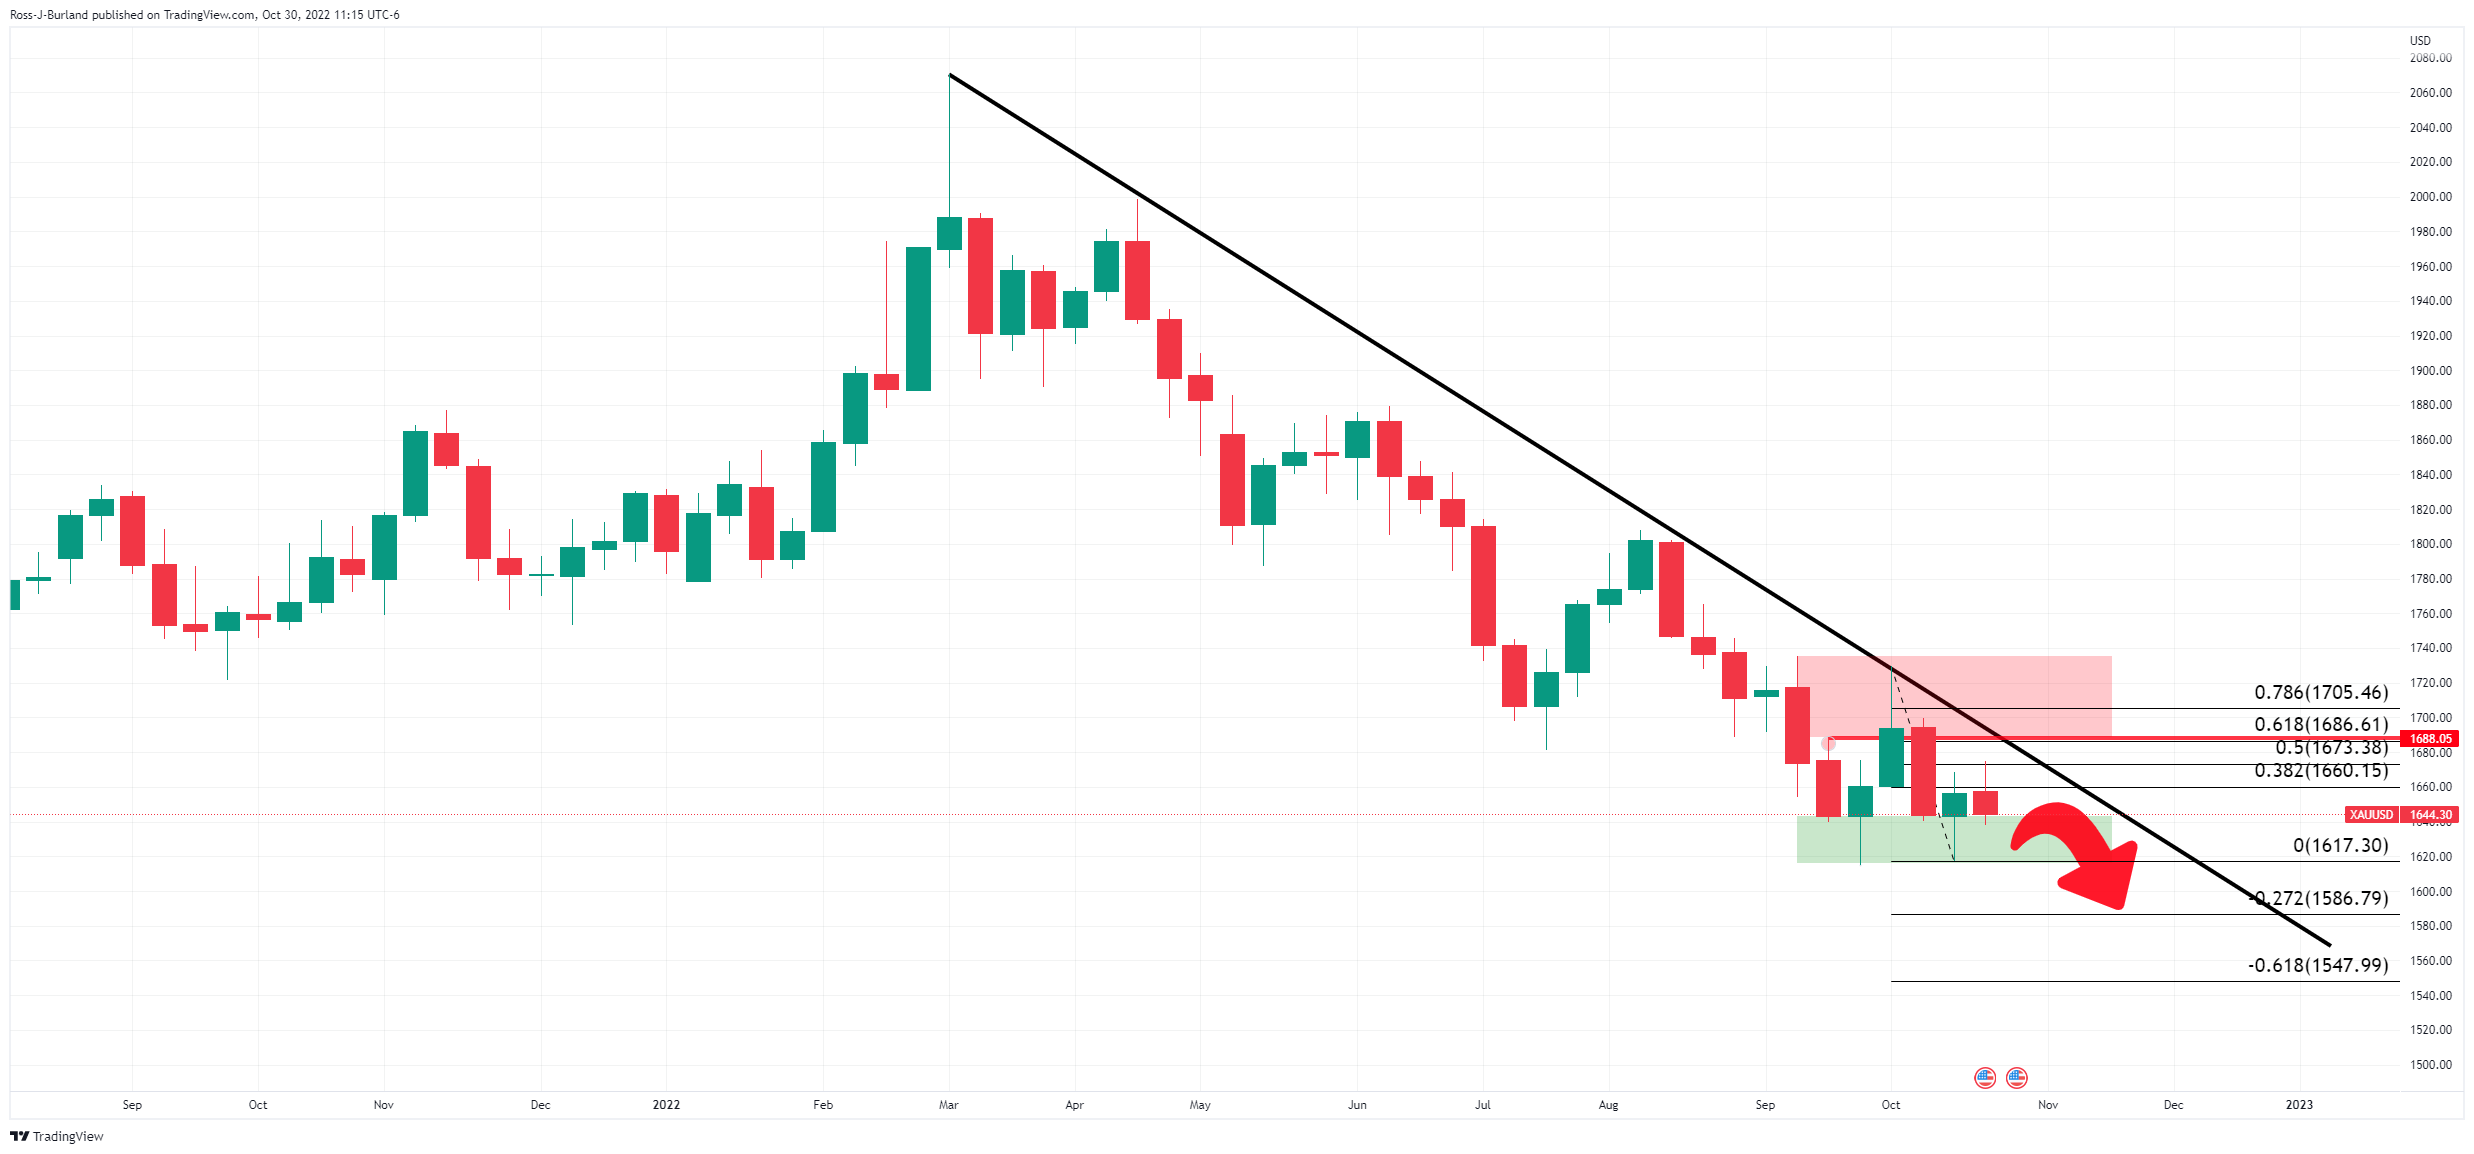
Meanwhile, on the downside, while below the weekly trendline, given that the price has already corrected to a 50% mean reversion of the prior bearish impulse, and considering it has failed to break key resistance so far, there is a strong argument for a downside extension:
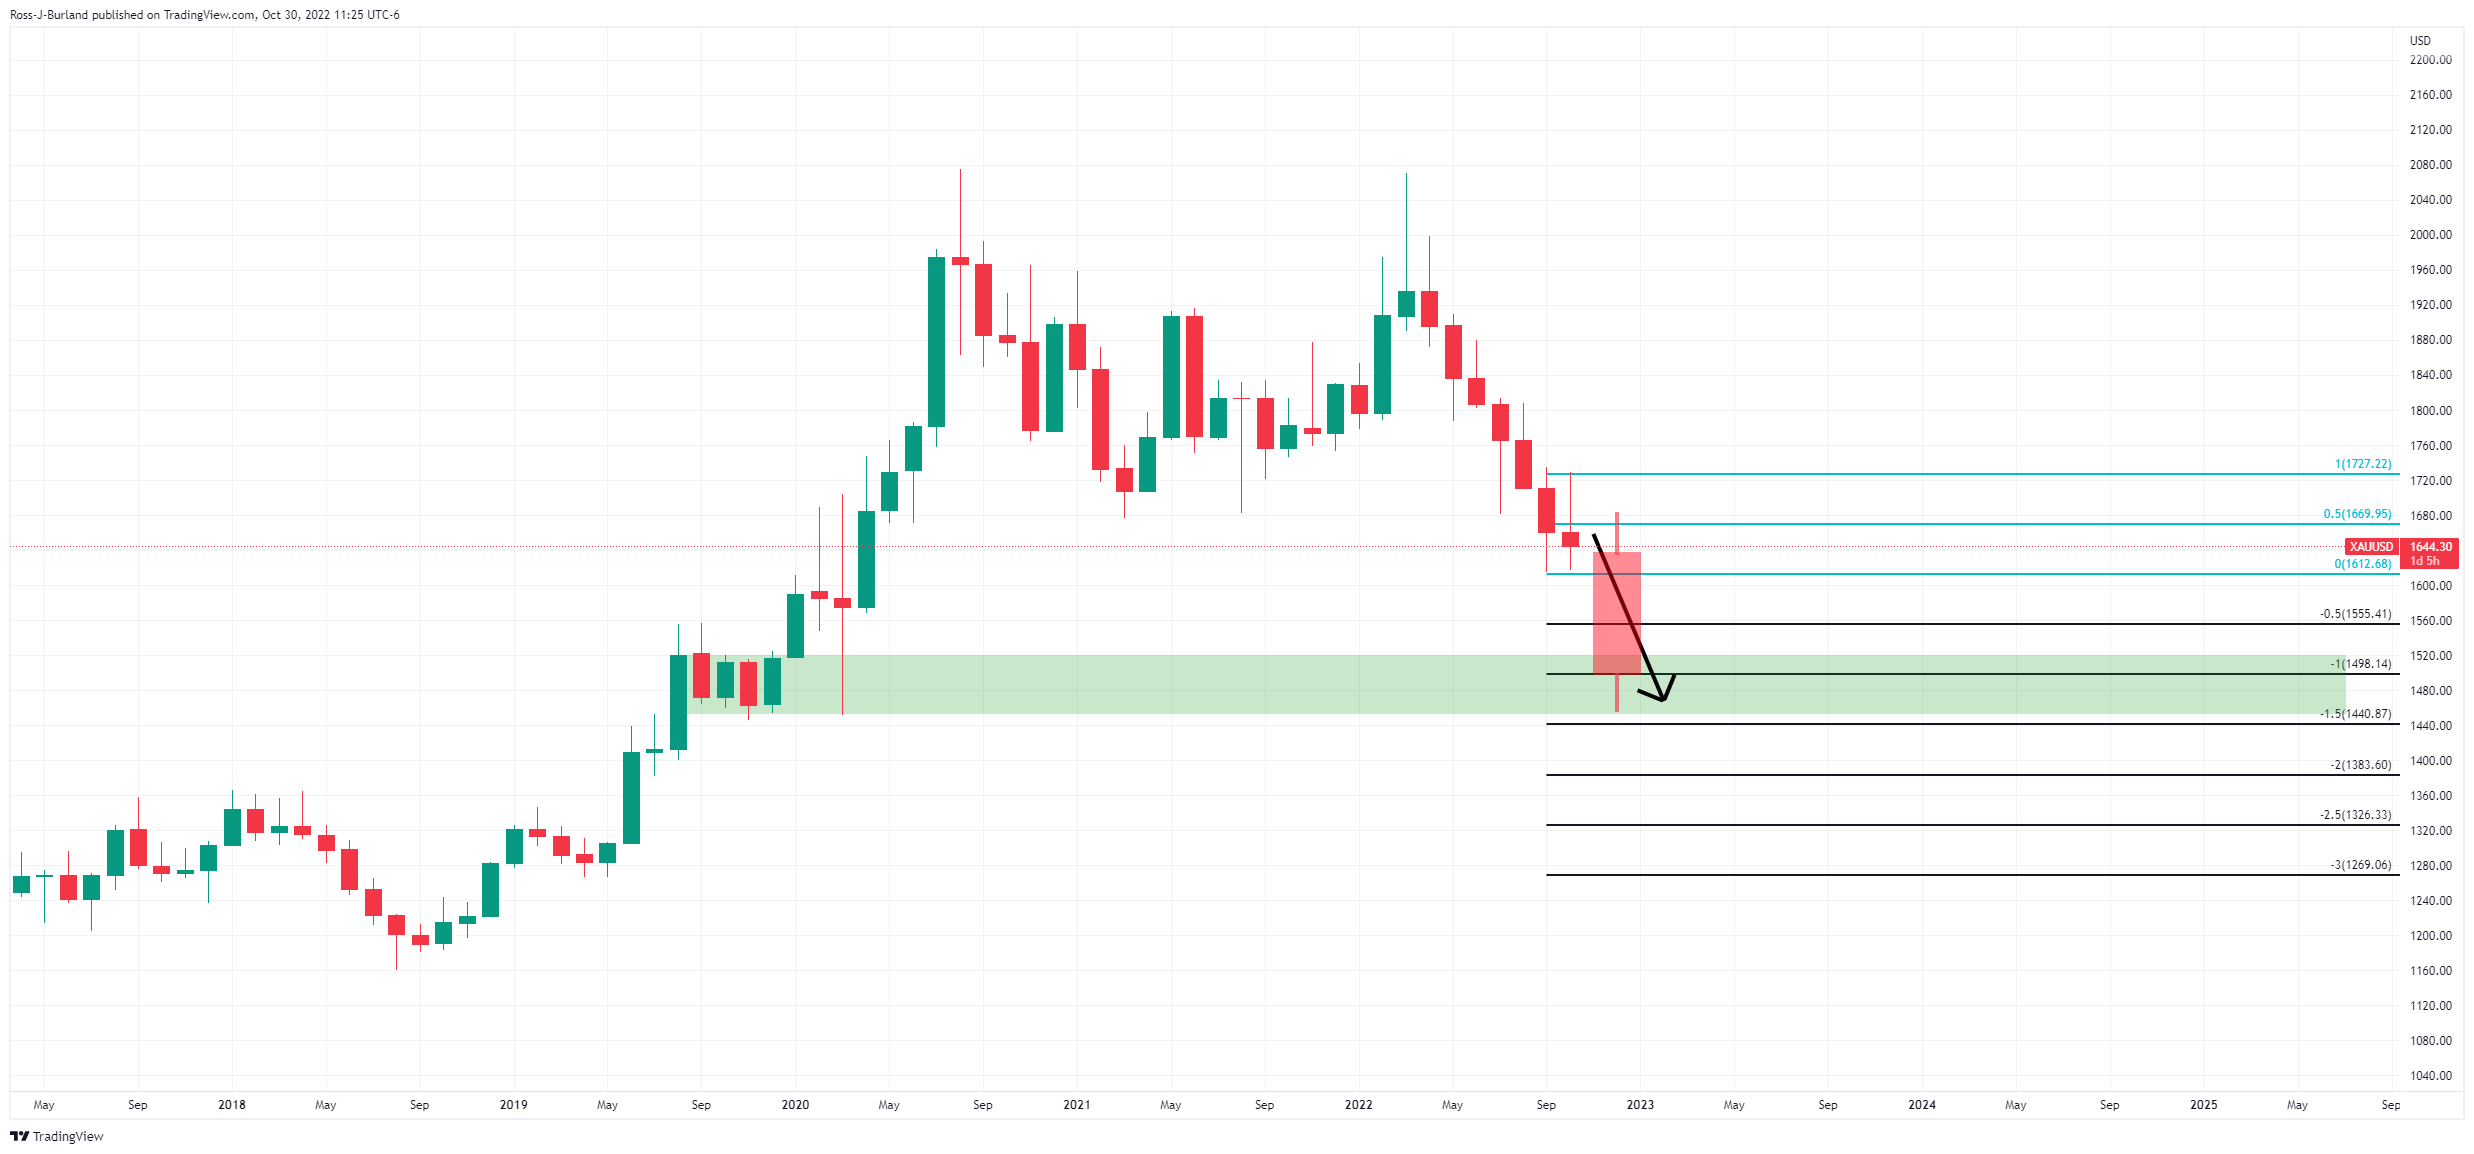
The monthly chart could turn out a November candle such as the following:
Premium
You have reached your limit of 3 free articles for this month.
Start your subscription and get access to all our original articles.
Author

Ross J Burland
FXStreet
Ross J Burland, born in England, UK, is a sportsman at heart. He played Rugby and Judo for his county, Kent and the South East of England Rugby team.


