|premium|

Gold, Chart of the Week: XAU/USD bulls eye a break of critical daily resistance

  • Gold price has come under pressure on a spot basis, but a break of daily resistance this week could be on the cards.
  • Meanwhile, mitigation of lower time frame price imbalances could be in play to start the week off. 

Before getting into the spot gold price technicals, analysts at TD Securities explained that money managers aggressively liquidated gold longs as a hawkish Fed continues to sap interest in the yellow metal.

''After all,'' the analysts said, ''as the world chases the same hawkish Fed narrative, position squeezes continue to drive price action in the yellow metal.''

''Notwithstanding, proprietary traders are the cohort raising risks of additional liquidations, after having built a massive and complacent position since the pandemic. While the war in Ukraine has sent the bears packing at prop-shops, the cohort's longs have yet to capitulate. This week, prop traders only marginally liquidated their length, whereas the breadth of traders long hasn't budged, suggesting a liquidation event is still forthcoming.''

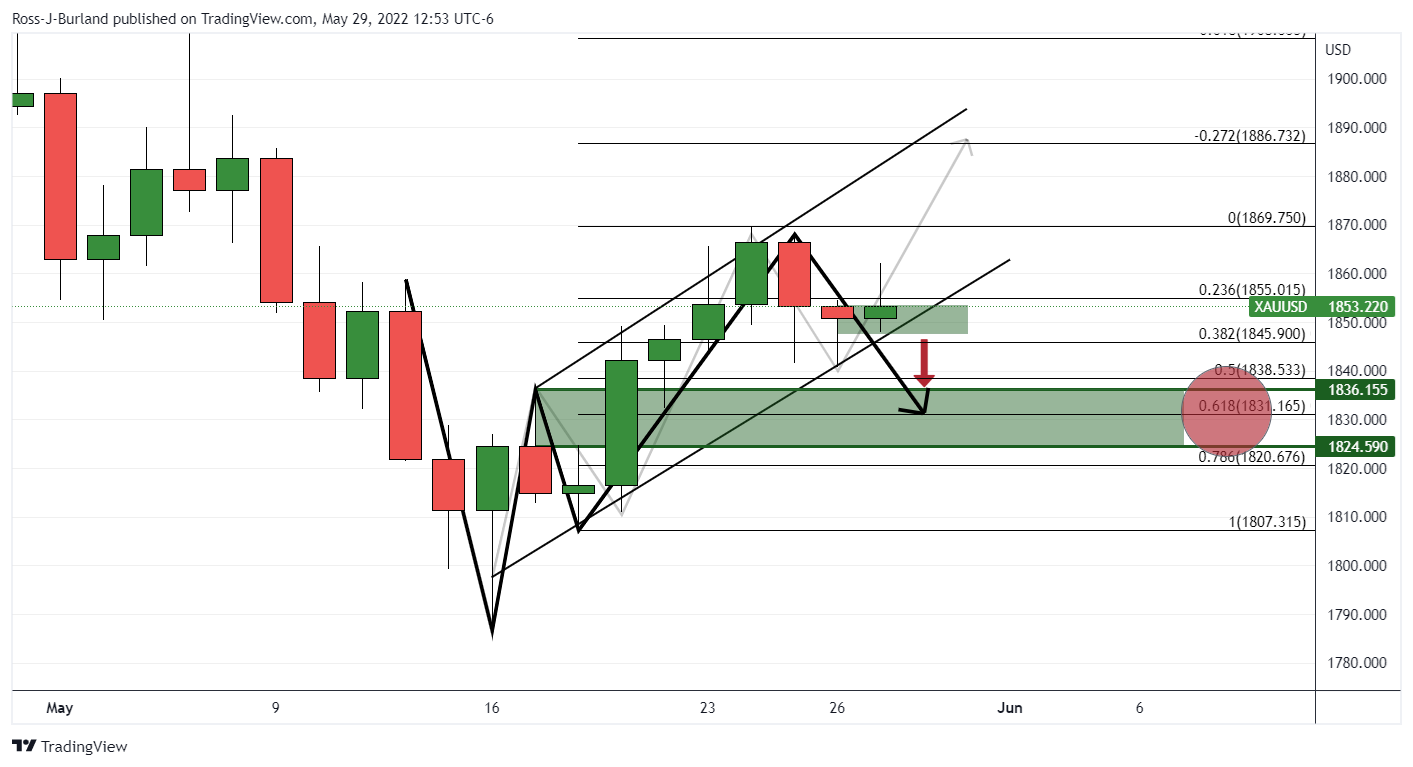
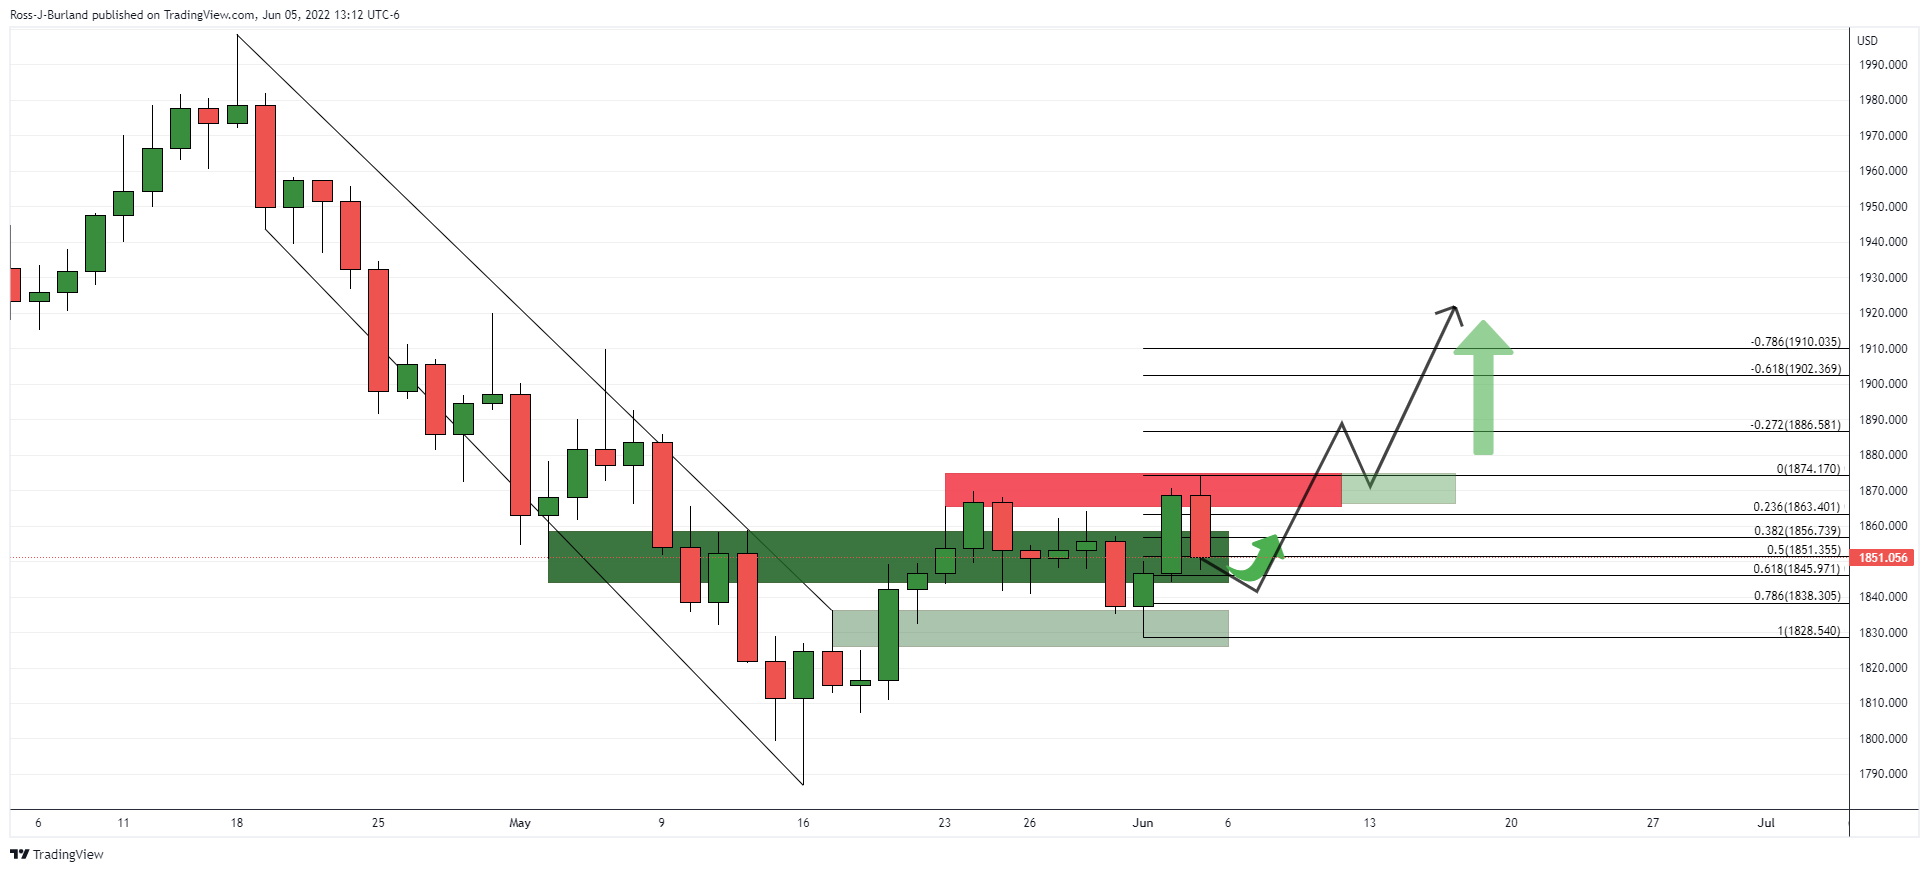
For the technical outlook, as per the prior pre-open analysis for last week, Gold, Chart of the Week: XAU/USD bulls need to hold $1,850 or a 61.8% golden ratio will be next on bear's menu, it was shown that the daily chart's W-formation's neckline near a 61.8% golden ratio was yet to be fully tested:

Gold daily chart, live market

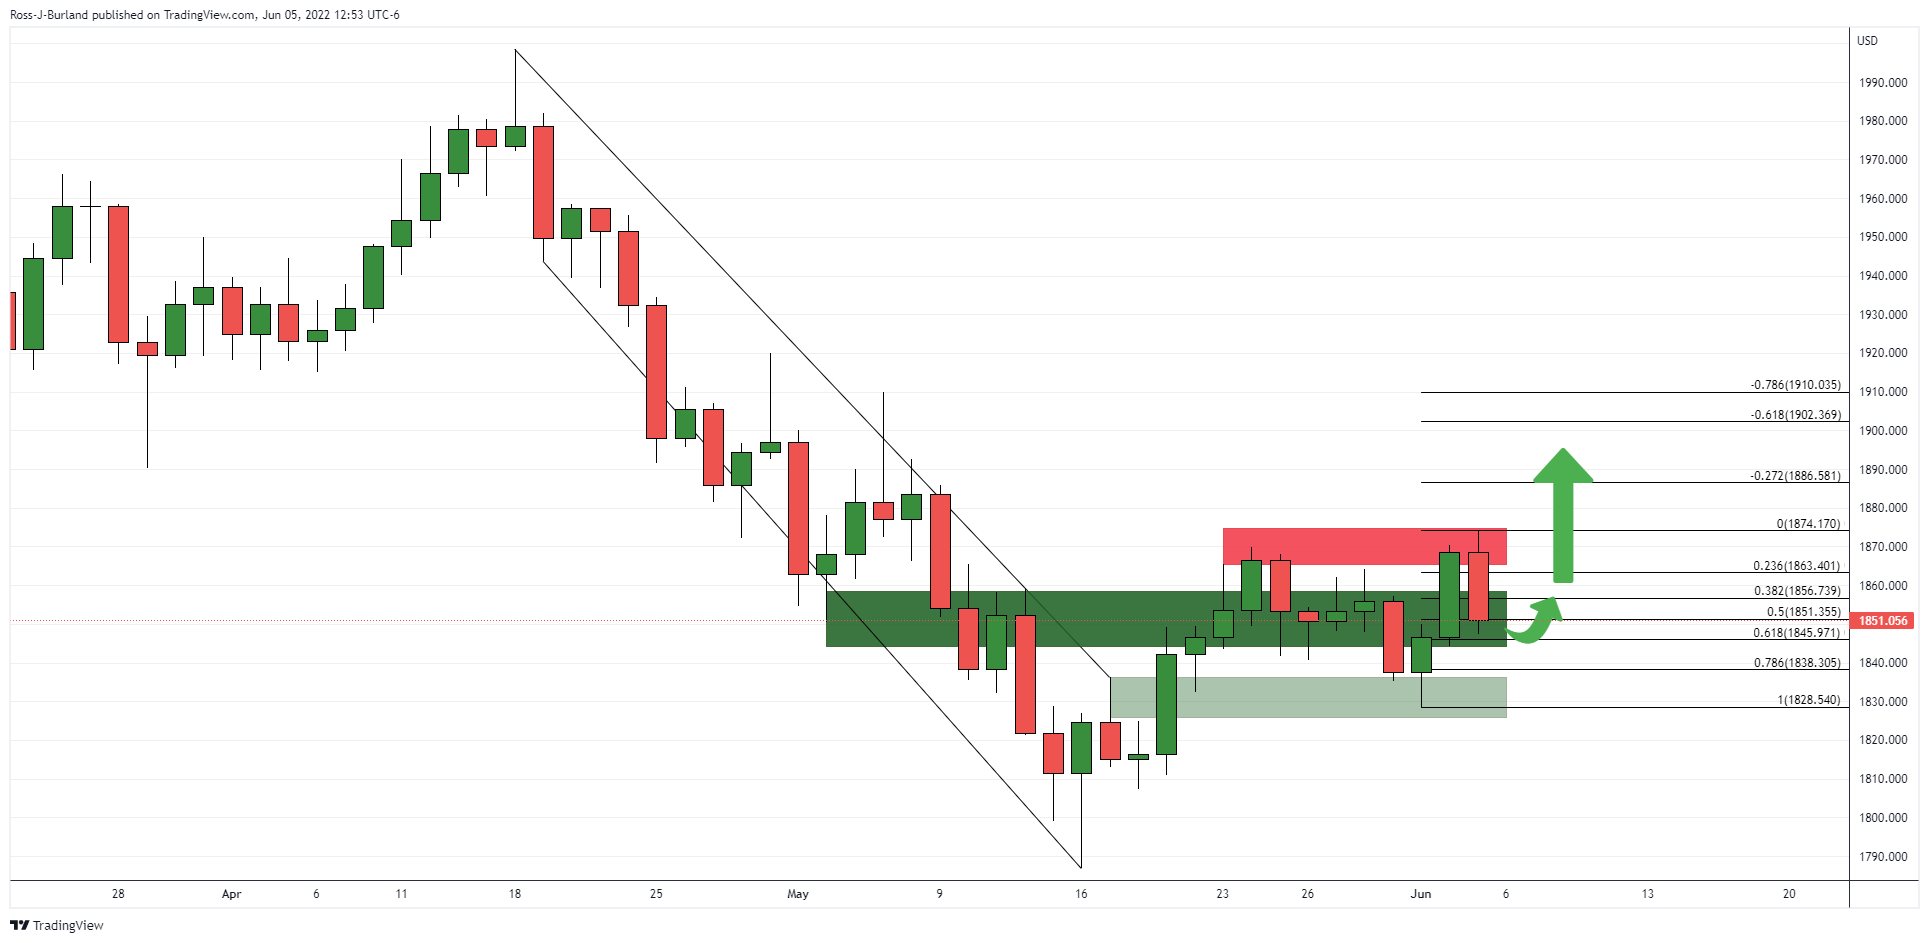
As illustrated, the price moved in on the area and completed the retest of the neckline. This now offers prospects of a move higher from here following the move out of the downside channel. However, the resistance will need to give:

Gold, H1 chart

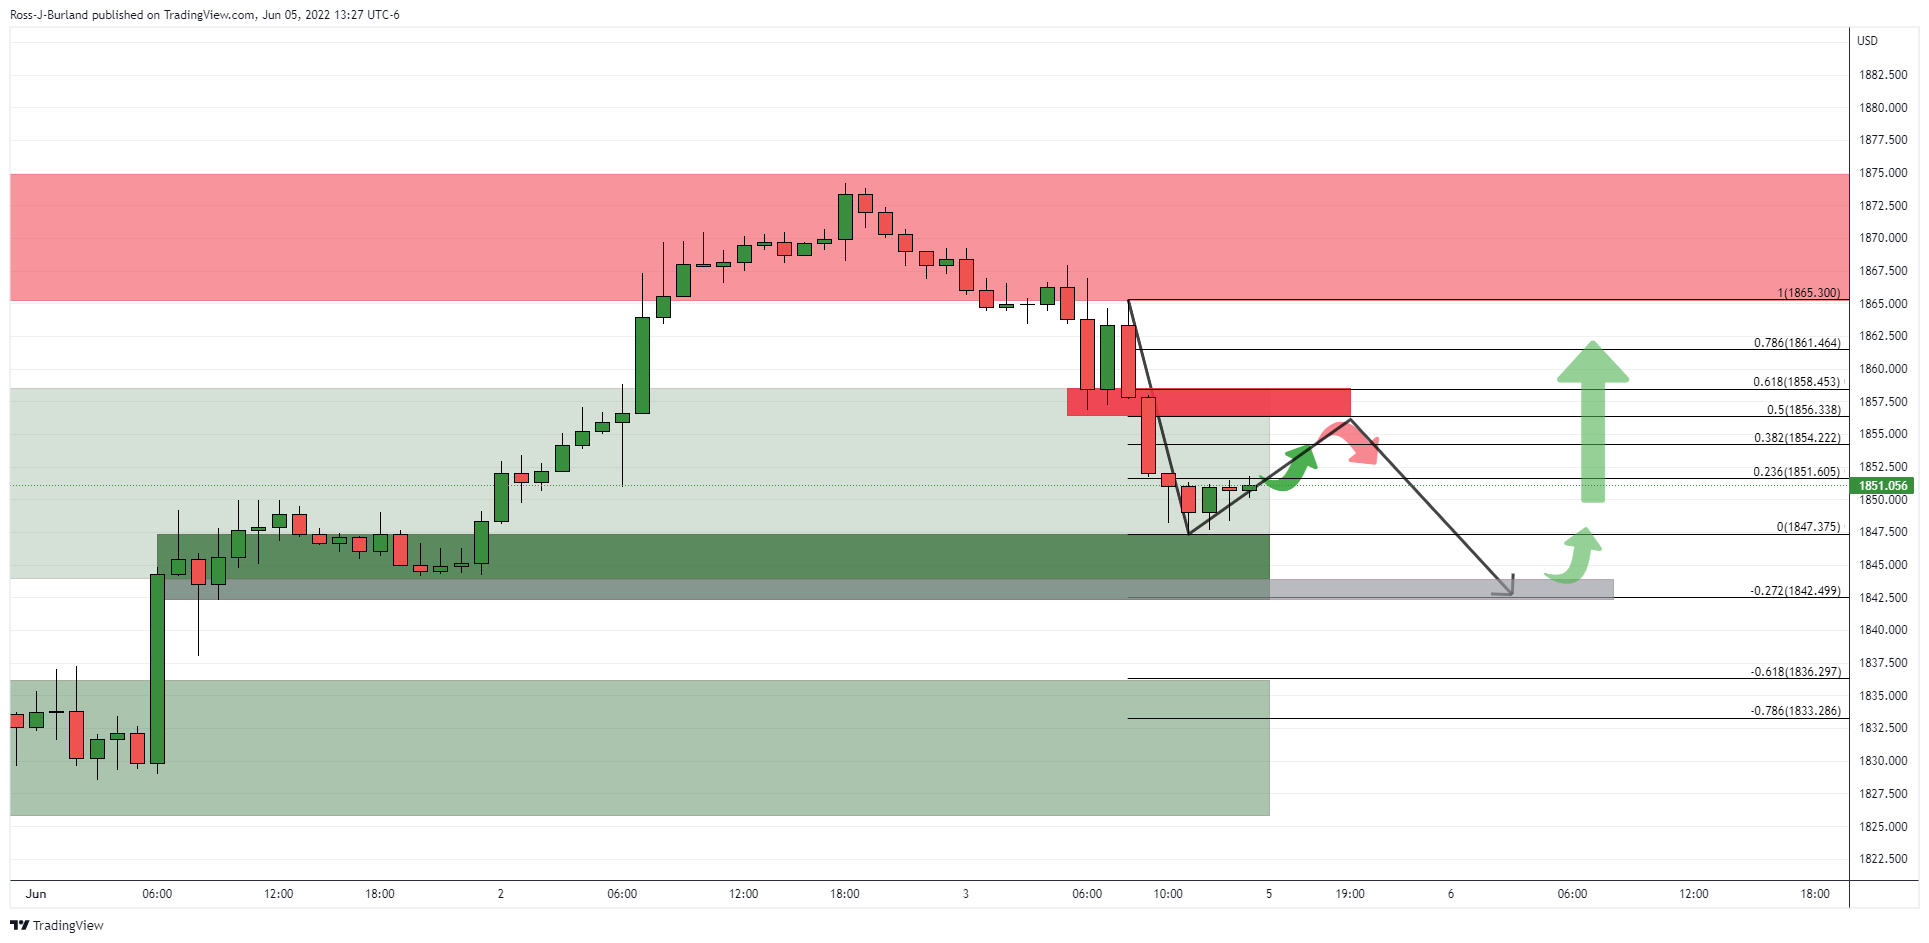
For the open, the hourly chart could see some initial bids come through to mitigate some of the latest bearish impulse. The 50% mean reversion area aligns with the prior support as a target. However, should resistance hold up, there could be a move into the downside to fully test the demand area in the $1,840s again. 

Premium

You have reached your limit of 3 free articles for this month.

Start your subscription and get access to all our original articles.

Subscribe to PremiumSign In

Author

Ross J Burland

Ross J Burland, born in England, UK, is a sportsman at heart. He played Rugby and Judo for his county, Kent and the South East of England Rugby team.

More from Ross J Burland
Share:

Editor's Picks

AUD/USD languishes near two-month low amid renewed Iran tensions

AUD/USD holds above 0.7000 during the Asian session on Wednesday, though it remains close to a nearly two-month low set the previous day. Fresh US strikes on Iran temper hopes for a peace deal and benefit the safe-haven US Dollar. Furthermore, inflationary concerns continue to fuel hawkish Fed expectations, lending additional support to the buck ahead of the US CPI report. Adding to this, reduced bets on an RBA rate hike in June cap the currency pair.


USD/JPY sits near 160.50 intervention zone as bulls shrug off Japan's strong PPI

USD/JPY consolidates just below mid-160.00s, or its highest level since late April, as economic concerns stemming from the Middle East conflict continue to undermine the Japanese Yen (JPY). Furthermore, a fresh wave of US strikes on Iran benefits the safe-haven US Dollar and acts as a tailwind for the currency pair, countering Japan's hotter-than-expected PPI report. However, intervention fears cap the upside as traders seem hesitant ahead of the US consumer inflation figures later this Wednesday.

Gold flirts with $4,200, lowest since March 23 on hawkish Fed bets

Gold drops to a fresh low since March 23, around the $4,200 mark during the Asian session on Wednesday, as fresh US strikes on Iran fuel inflationary concerns and bolster bets for more hawkish central banks, including the US Fed. Meanwhile, US Dollar bulls are turning cautious ahead of the US CPI report, which could limit bullion losses. However, the recent breakdown below the 200-day SMA suggests that the path of least resistance for the XAU/USD is to the downside.

Bitcoin sell-off pushes over 50% of circulating supply into loss, hinting at market bottom

Bitcoin dropped near $61,000 on Tuesday, with the latest sell-off pushing long-term market indicators toward levels historically associated with bear-market bottoms, according to a report by K33 Research.

When the chips are down, the AI tape starts to shake

The market came into Tuesday trying to sell investors the comforting ”Turnaround Tuesday” idea that Friday’s AI fracture was just another pothole on the road higher. By the close, that story had lost its bid. Monday’s dead cat bounce had done what dead cat bounces always do.

The US economy defies the rules: 100 days into the Oil shock and the recession signal is still missing

More than three months after the start of the Iran war and the resulting disruption to global energy markets, the US economy continues to display remarkable resilience. The conflict has triggered a sharp rise in Oil prices, reignited inflationary pressures and fueled widespread concerns about a potential economic slowdown.