Gold, Chart of the Week: XAU/USD bulls are moving in trying to catch the falling knife
- Gold is accumulating above $1,700 and eyes are on a significant bullish correction.
- Bears, on the other hand, anticipate that the rally will ultimately fade faced with a wall of offers.

As per the prior analysis, Gold price could be on the verge of a significant correction, Fed meeting will be decisive, the gold price has mitigated a significant price imbalance on the weekly chart ahead of a critical event in this week's Federal Open Market Committee meeting.
From a fundamental standpoint, a correction makes sense as the clash between slowing growth and rate hikes will bring volatility to gold prices. Recession fears have led to dialling back in rates markets that have started to price out elevated odds for a 100bp hike. This has enabled the gold price to correct higher for a bullish weekly close on Friday and should the outcome of this week's Fed be in line with recent flattening in the US yield curves, then the gold price would be expected to maintain its corrective trajectory away from pre-pandemic levels.
On the other hand, analysts at TD Securities argue that from a positioning lens, the behemoth position held by the average prop-trader is still nearly twice its typical size, suggesting a substantial amount of pain will reverberate across gold markets as prices revert lower. ''We have yet to see capitulation in gold, suggesting the recent rally will ultimately fade faced with a wall of offers.''
US 10-year yield bleeds-out
Meanwhile, the technicals can do the talking. Taking into account, first of all, the fall out in yields. The 10-year yield is trading near 2.734%, the lowest since May 27:
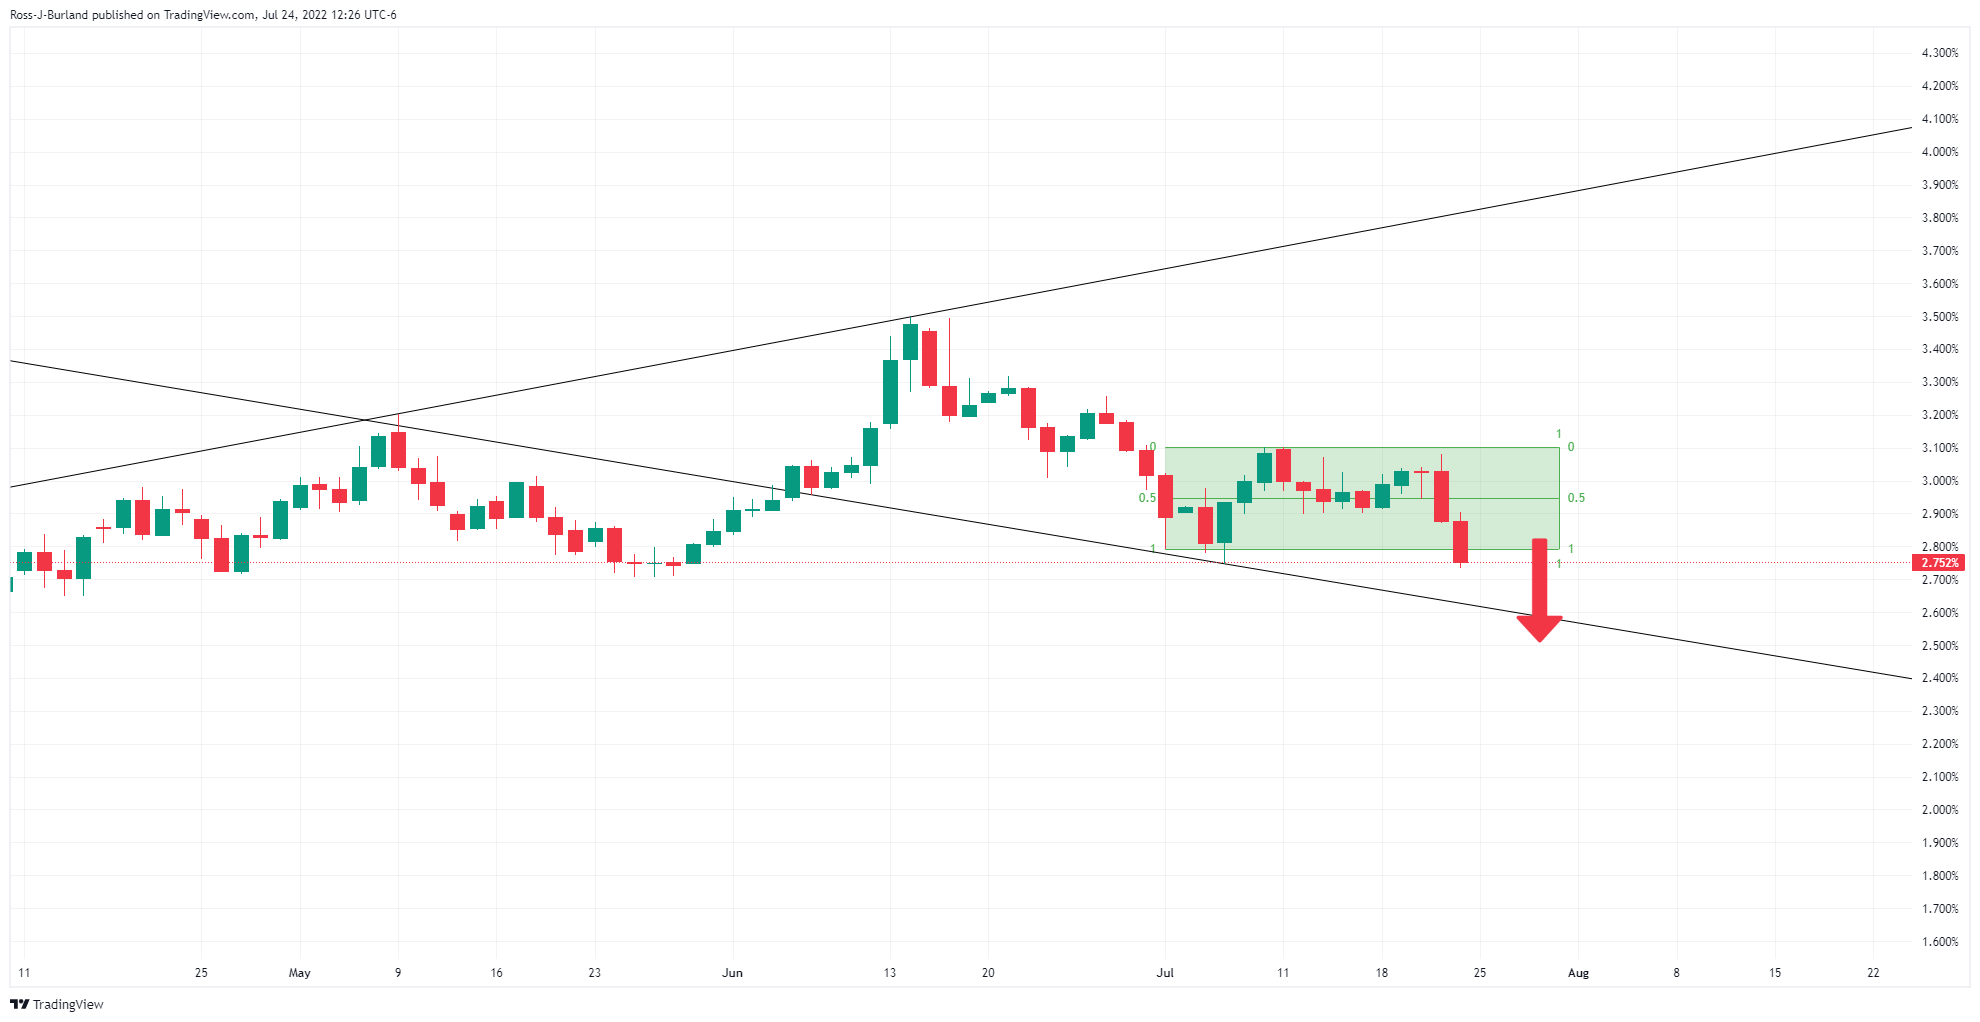
The broadening formation is compelling which allows more room to the downside, which could be expected to support gold prices.
Gold weekly chart
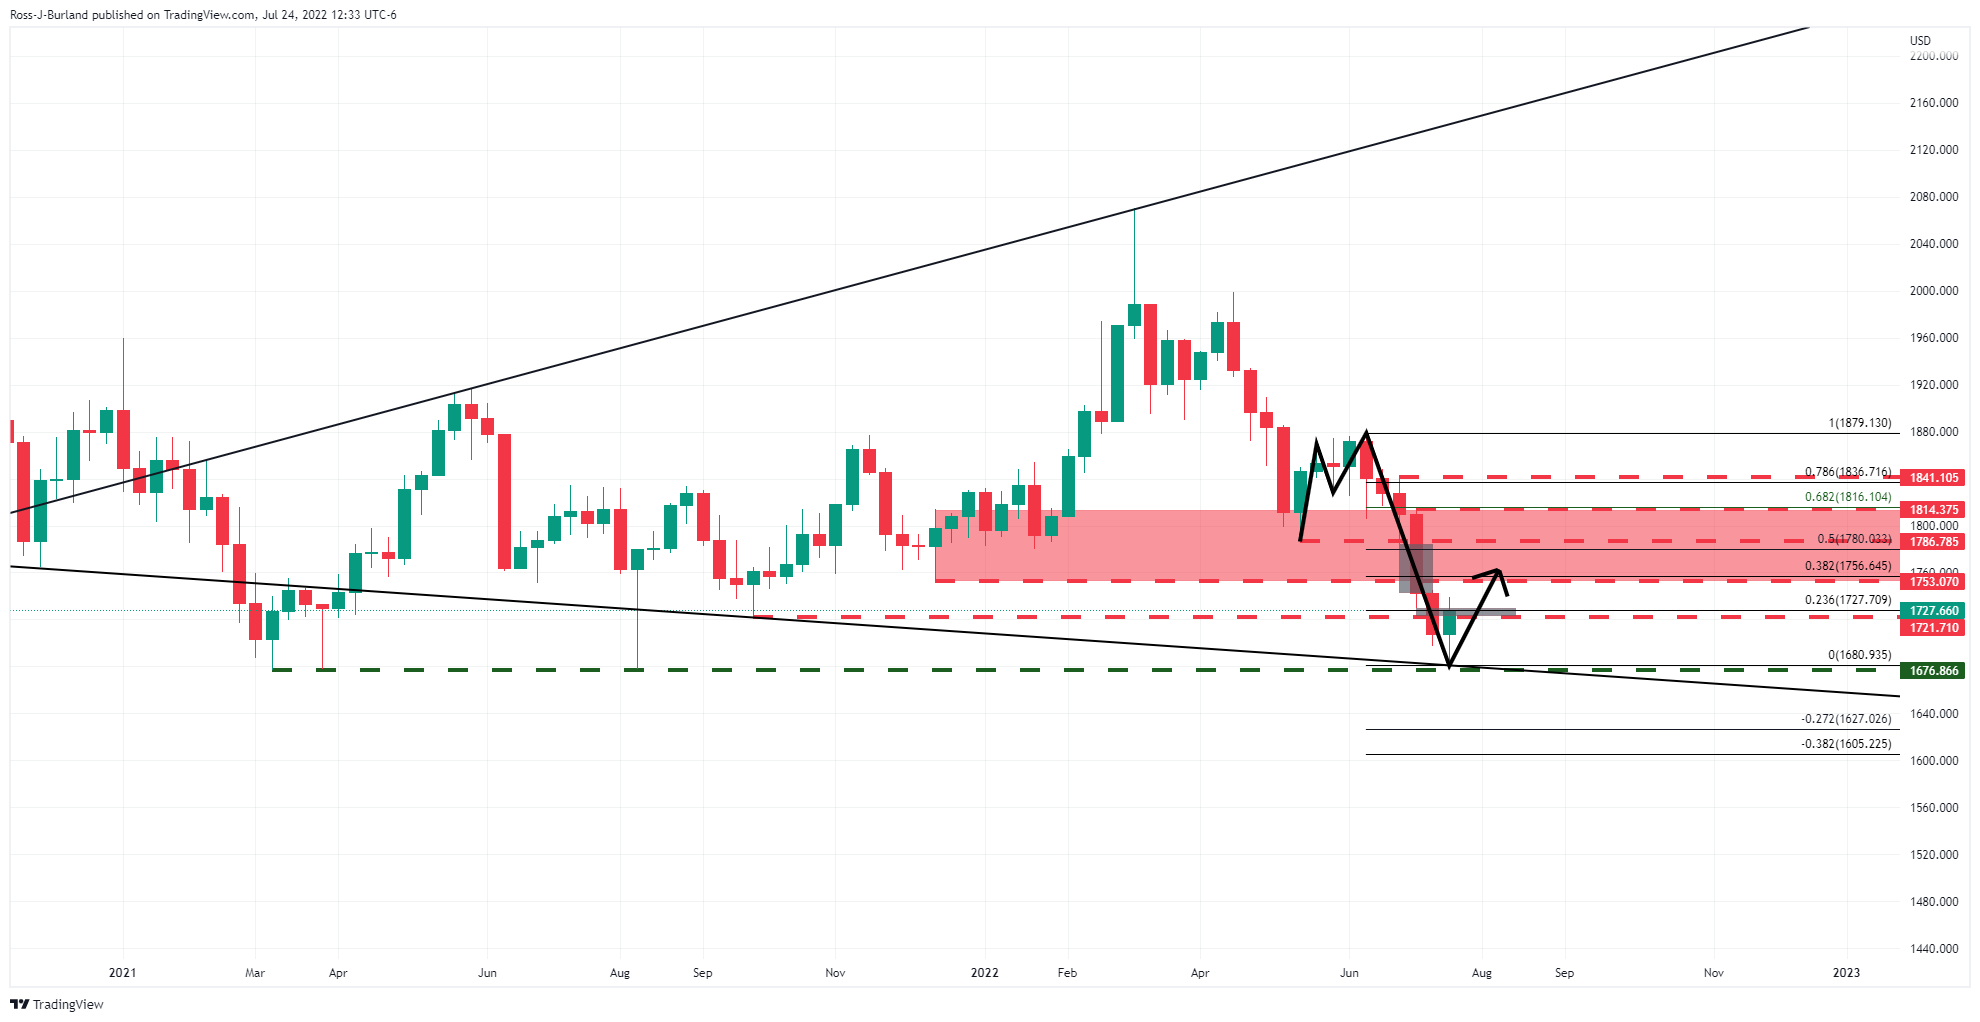
The M-formation is a strong feature on the gold charts with a 50% mean reversion on the cards should the next major area of price imbalance be mitigated, grey area, on the way to a potential 61.8% golden ration reversion:
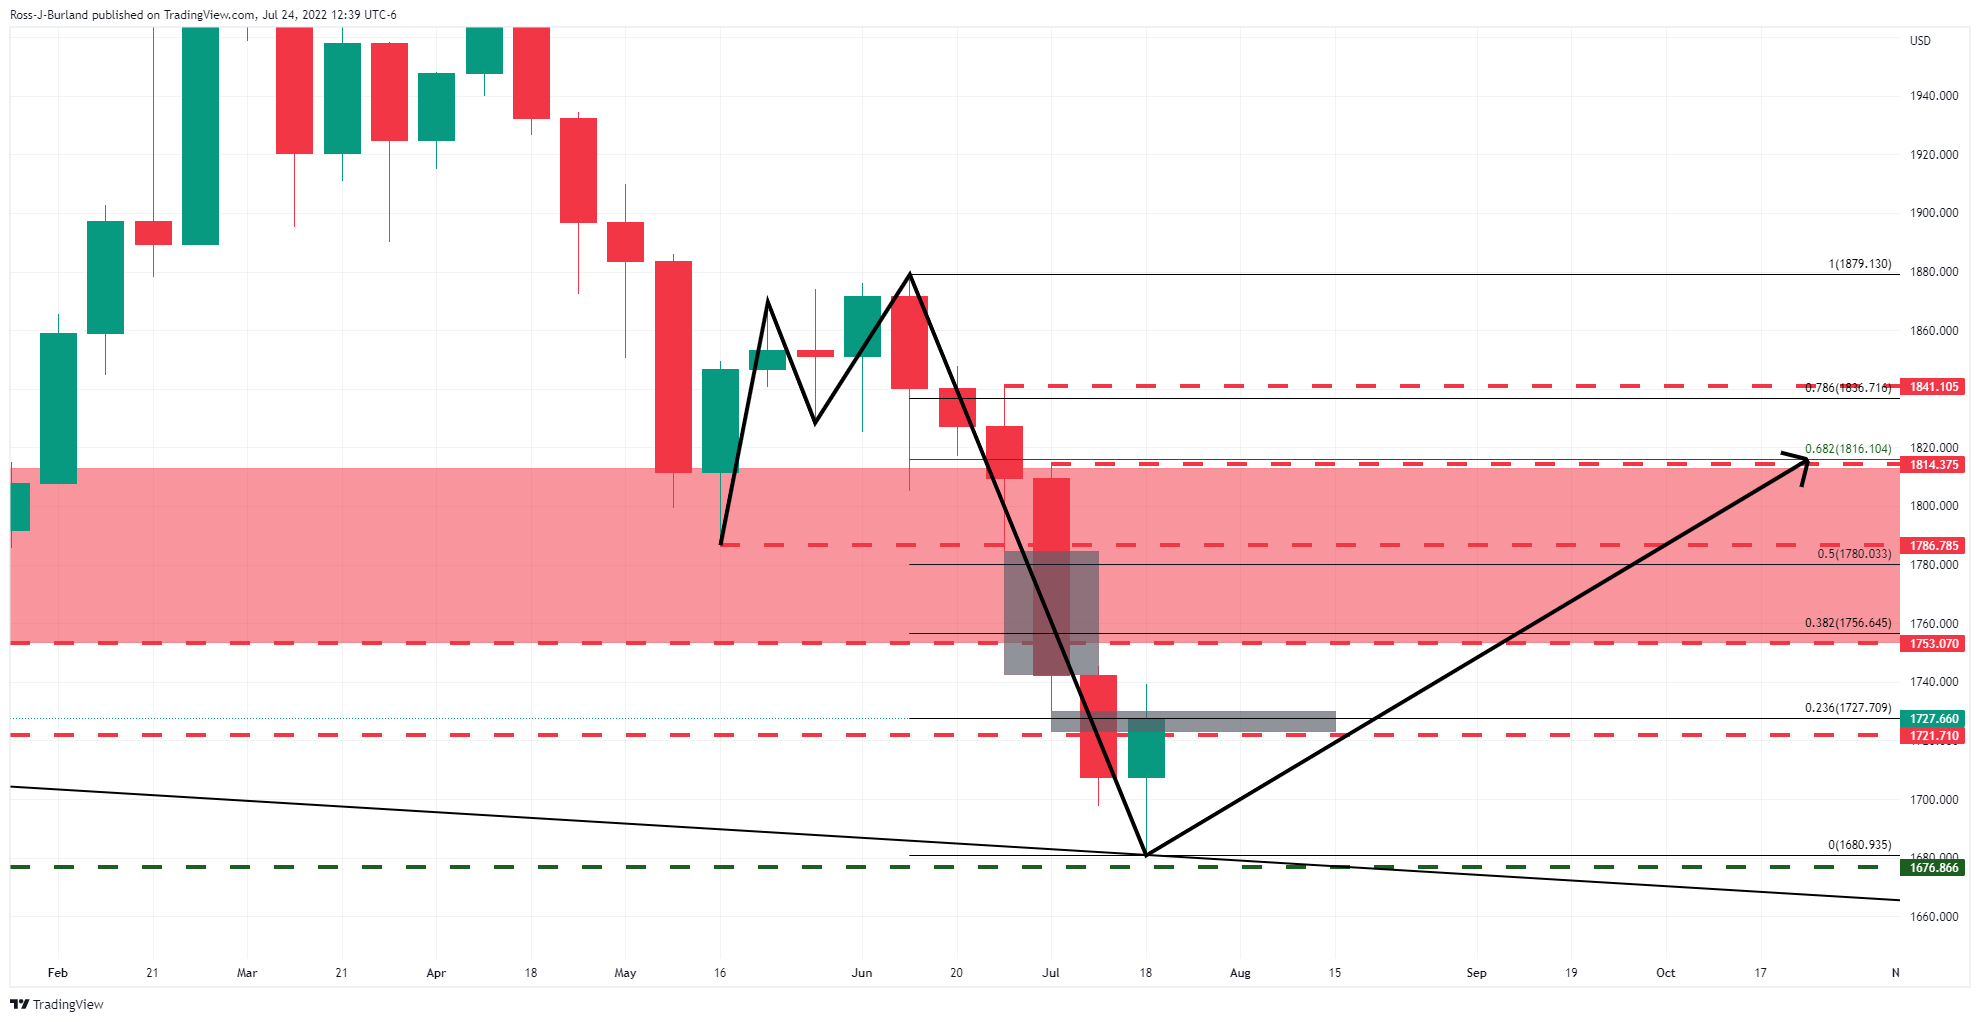
Gold daily chart
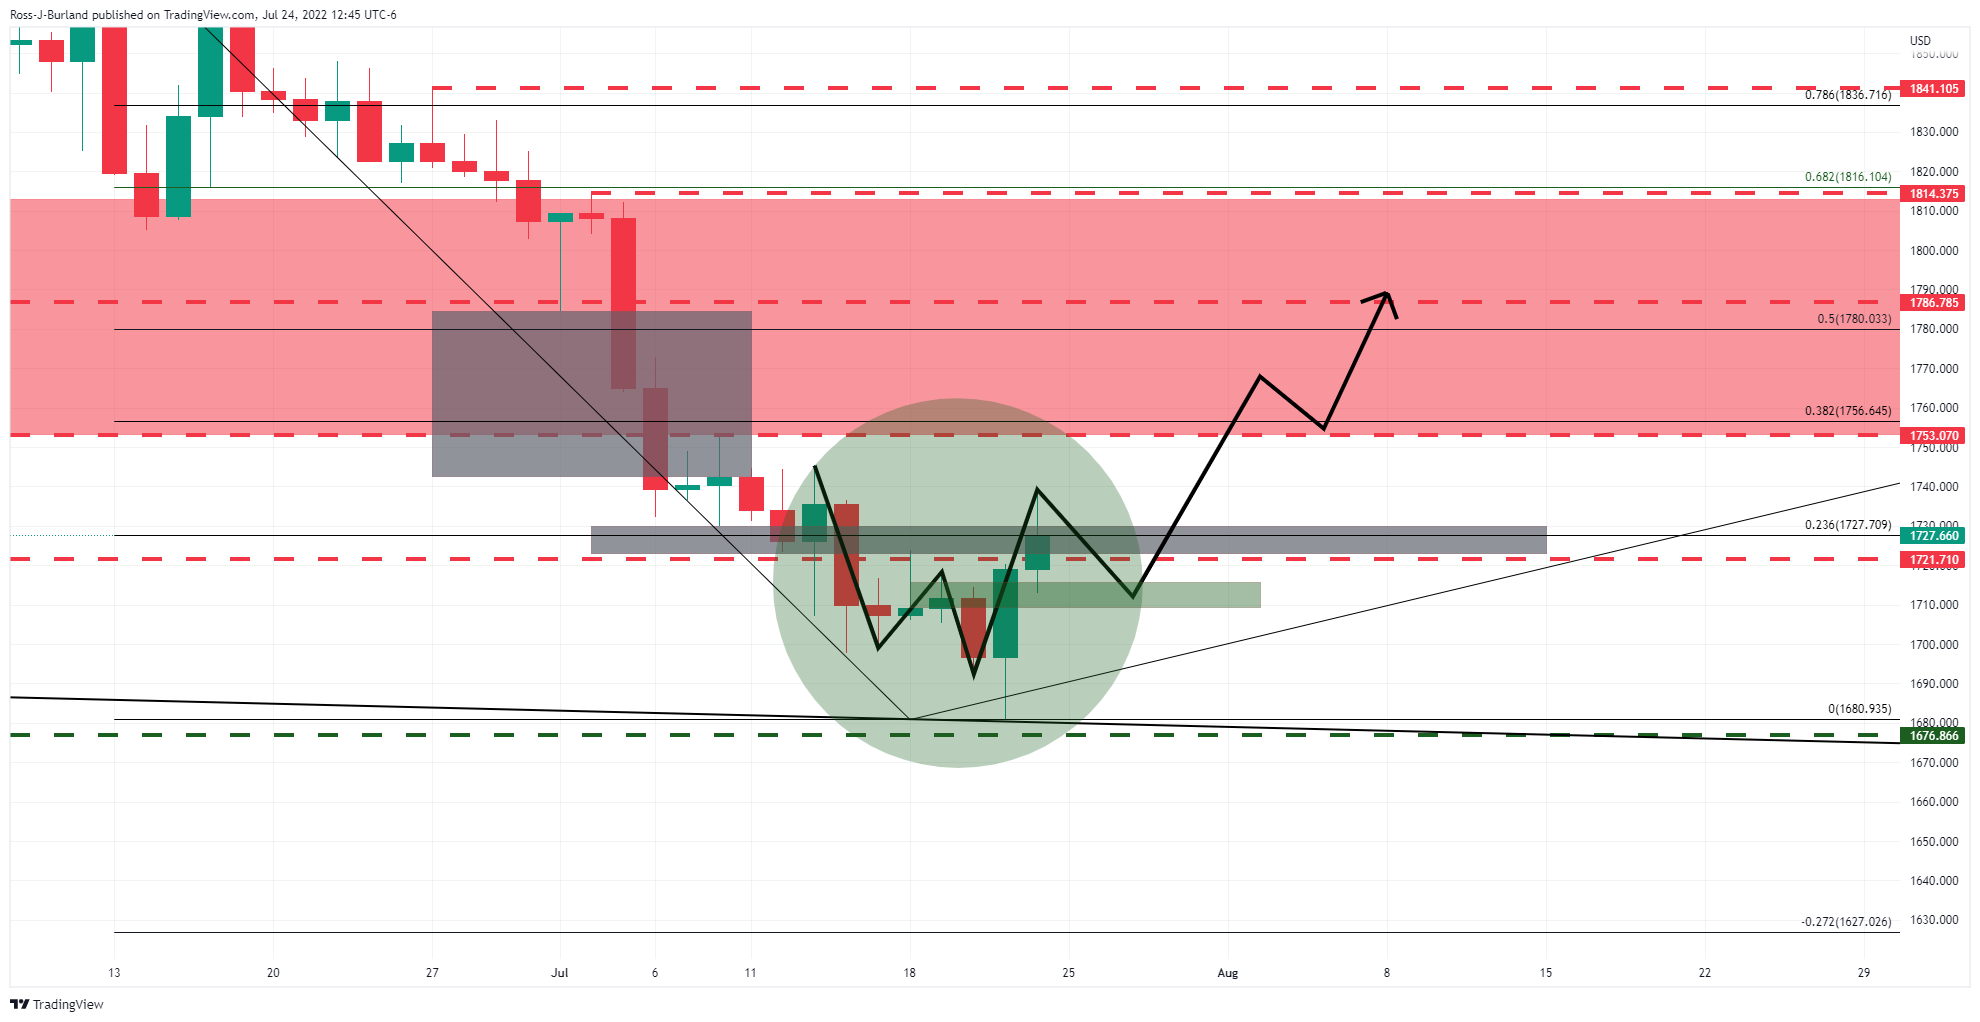
Meanwhile, the daily chart's W-formation is a probable pull on the gold price where it would be expected to revisit the neckline for a restest of the bull's commitments near $1,700 prior to a full-on drive higher in the coming days.
Author

Ross J Burland
FXStreet
Ross J Burland, born in England, UK, is a sportsman at heart. He played Rugby and Judo for his county, Kent and the South East of England Rugby team.


