Gold Chart of the Week: Possible bear scalp for the open, longer-term outlook is mixed
- Gold is setting up for a potential scalping opportunity to the downside for the open.
- Gold is a mixed picture on the longer-term time frames.

The price of gold plunged on Friday to test below the daily dynamic support line in a bullish trend that has been building since the start of October. This could be the start of a fresh move to the downside of the last liquidity run before a significant move to the upside.
The following is a top-down analysis of the price of gold. It is also worth noting that higher inflation expectations and lower yields in the long end of the curve have prompted speculators to aggressively increase net exposure early last week, according to the latest CFTC data collated by the end of the week.
''Traders covered their still sizable short positions on expectations that ten-year real yields below -1% will prevent any sharp corrections,'' analysts at TD Securities explained.
''At the same time, money managers increased long exposure in response to higher-than-expected inflation and to a Fed which has stuck to its view that elevated price increases will be transitory in nature. However, with gold trading above $1,800/oz and many market participants expecting the FOMC to pull the trigger on tapering next week, investors likely reduced length which drove prices down to the $1,780/oz range during the last trading session of the week.''
Gold monthly chart
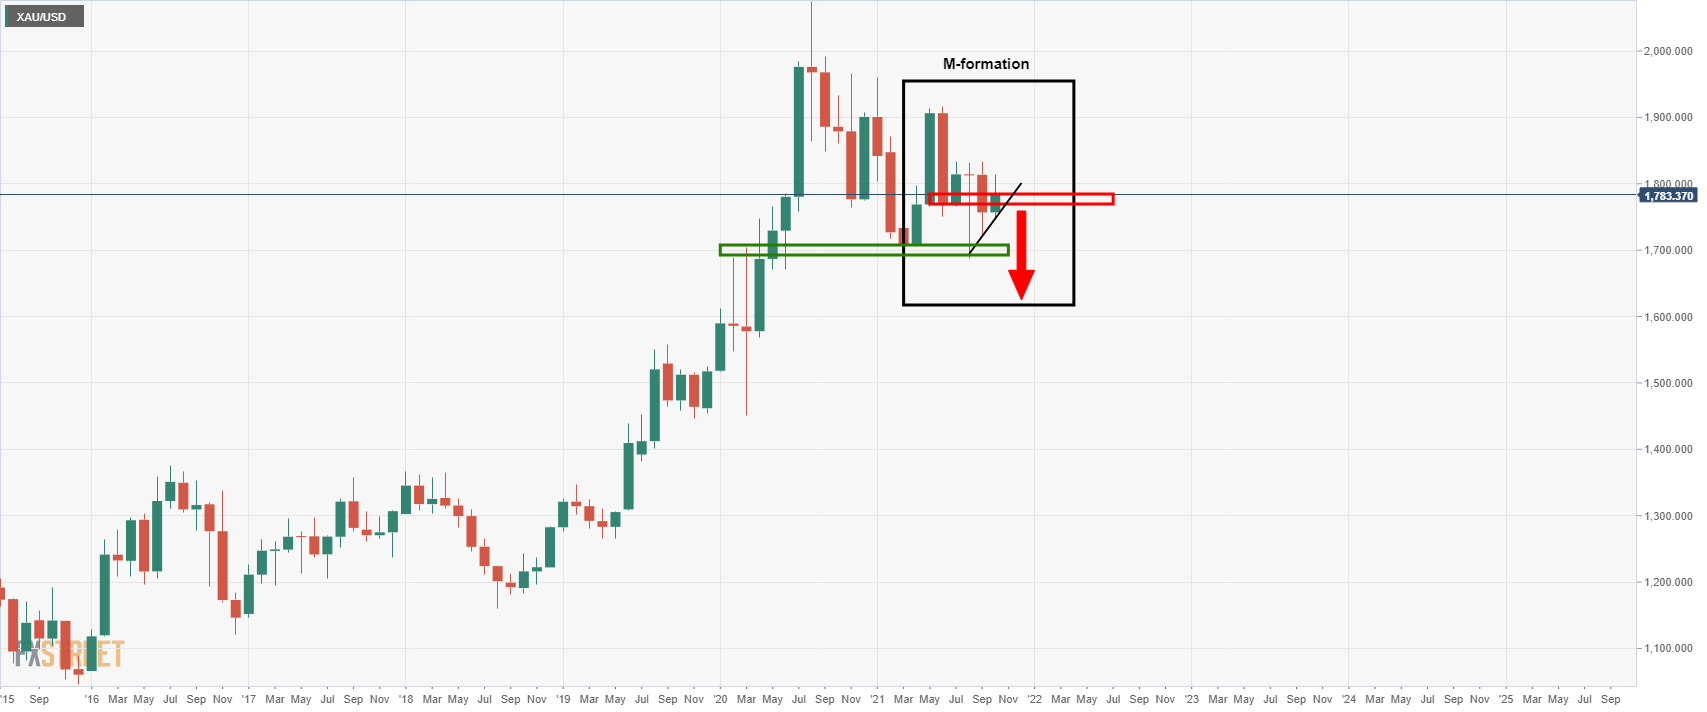
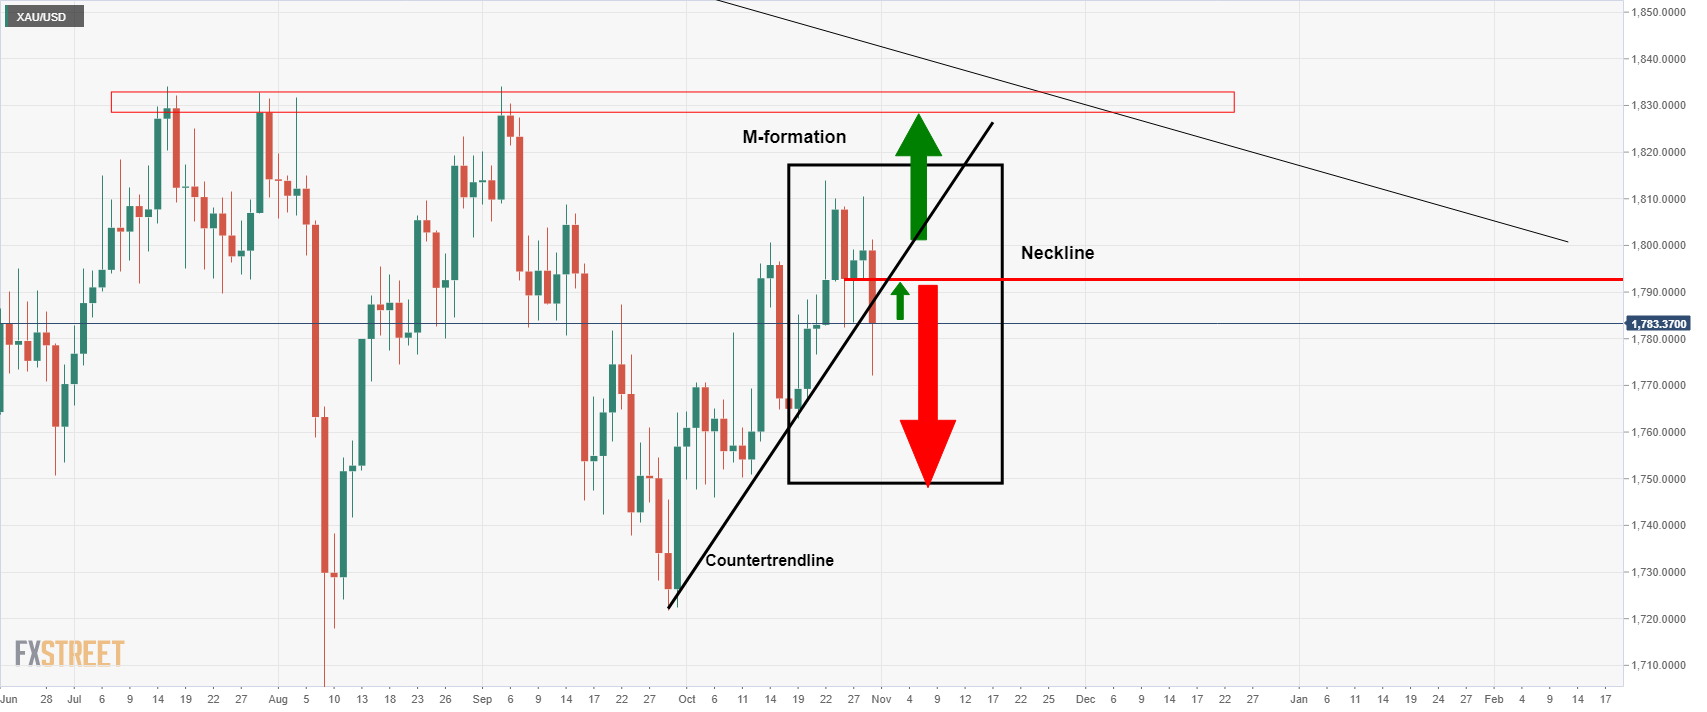
On the monthly chart, we have an M-formation. However, it is easier to see on the line chart as follows:
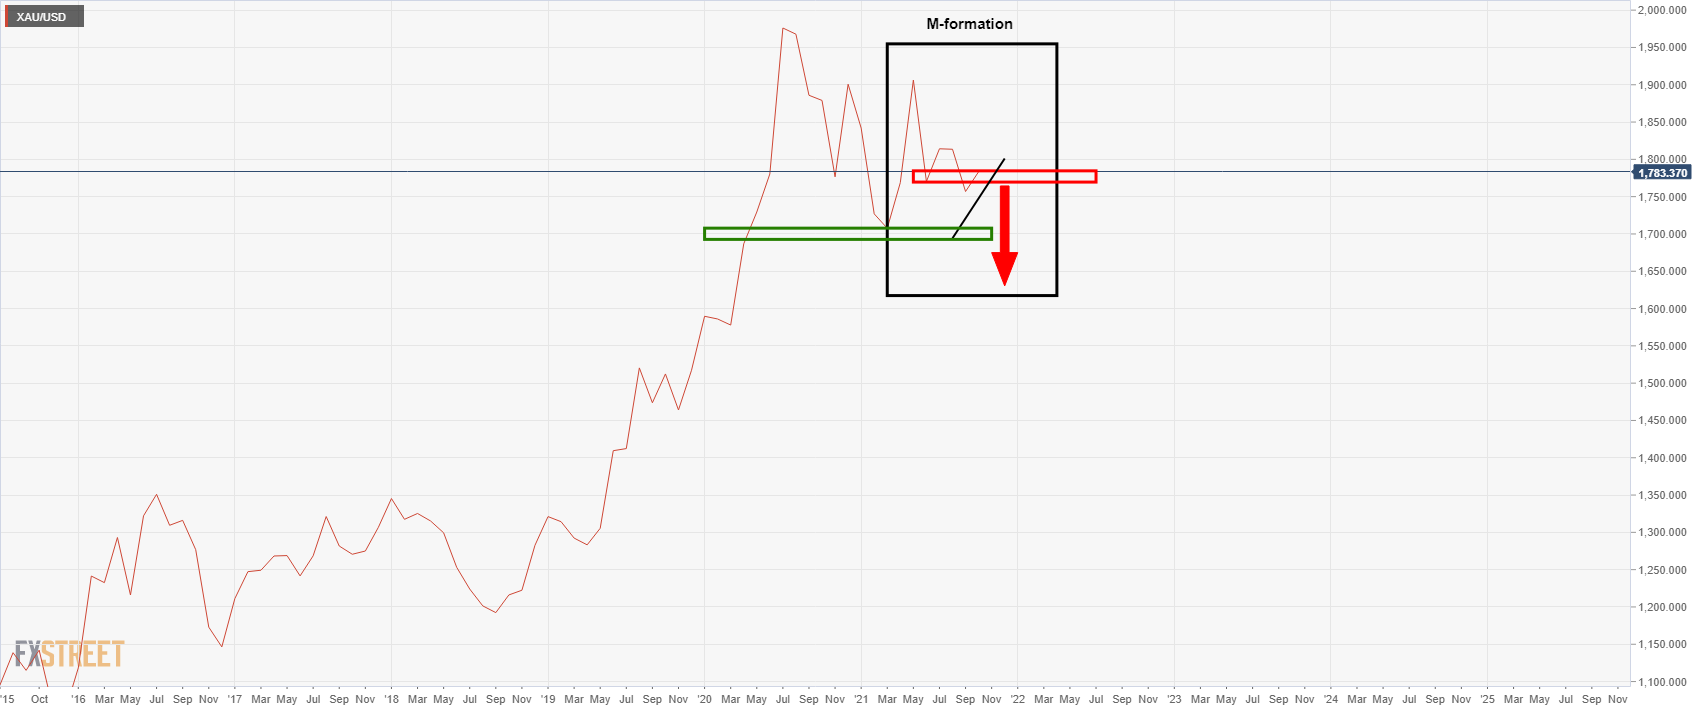
This is a reversion pattern that has already played out. The prior downside move reverted back to test the neckline of the formation of 1,770 which was expected to act as resistance and therefore lead to the next downside leg. The next downside leg can be traded on a fractal basis, i.e. from bearish structures formed on lower time frames, such as the daily and 4-hour charts.
However, that is not to say that the current upside leg cannot break the resistance on a monthly basis and lead to a fresh bullish opportunity in the weeks ahead. Given that we have seen a break of 1,770 and we are at month-end, the bulls have set themselves up favourably for the weeks ahead. With that being said, a break below the dynamic supporting trendline on a monthly basis will be a significantly bearish development. Bears in this respect will be looking for closes below 1,750.
Gold weekly chart
From a weekly basis, we are seeing a mixed signal with the W-formation:
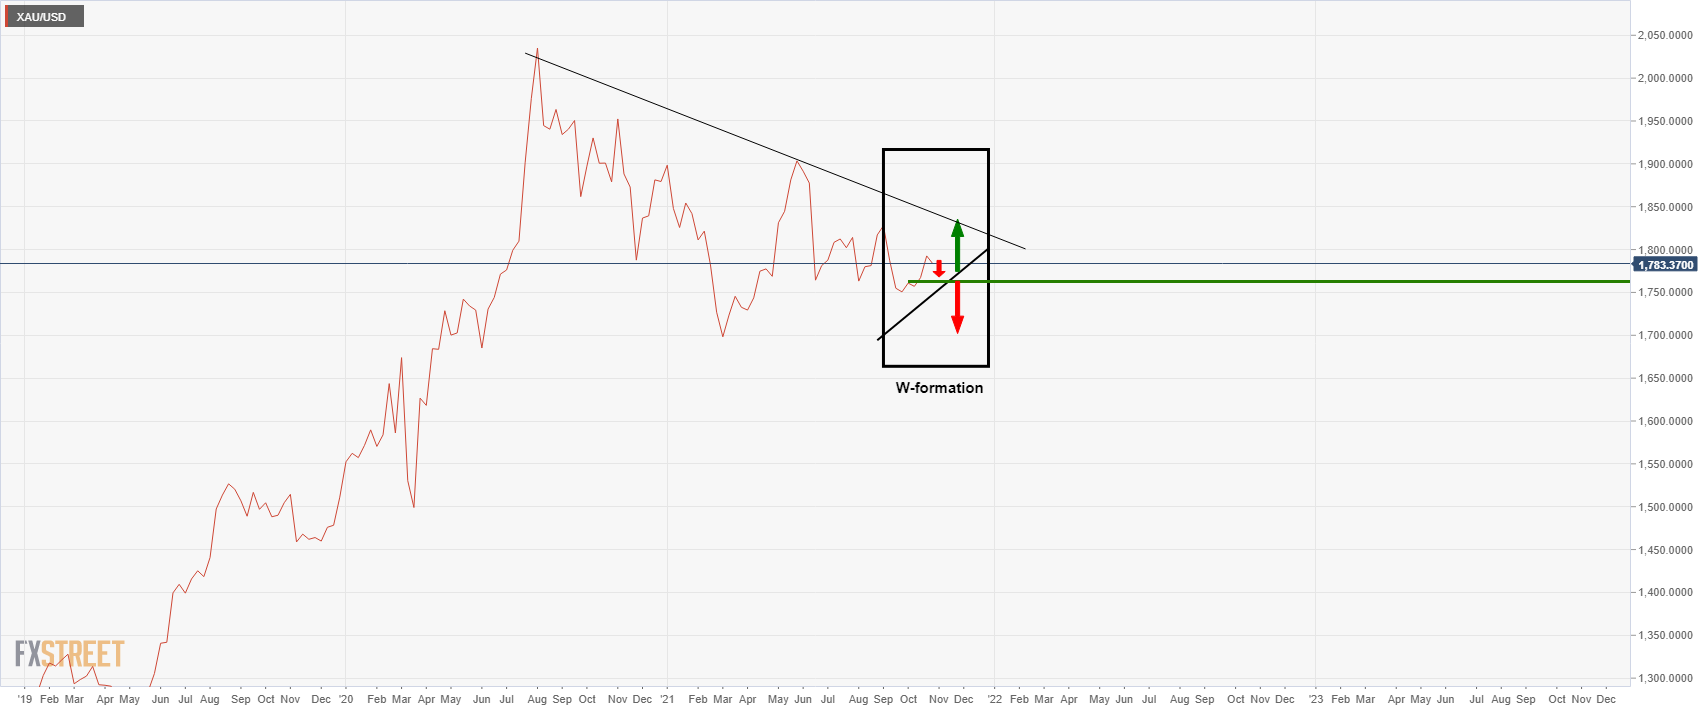
There is therefore an opposite scenario to the monthly chart's outlook at present that could lead to a test of the neckline near 1,760 for the opening days this week which will leave 1,750 exposed.
Gold daily chart
And, now we have an M-formation on the day chart with risk to 1,793:
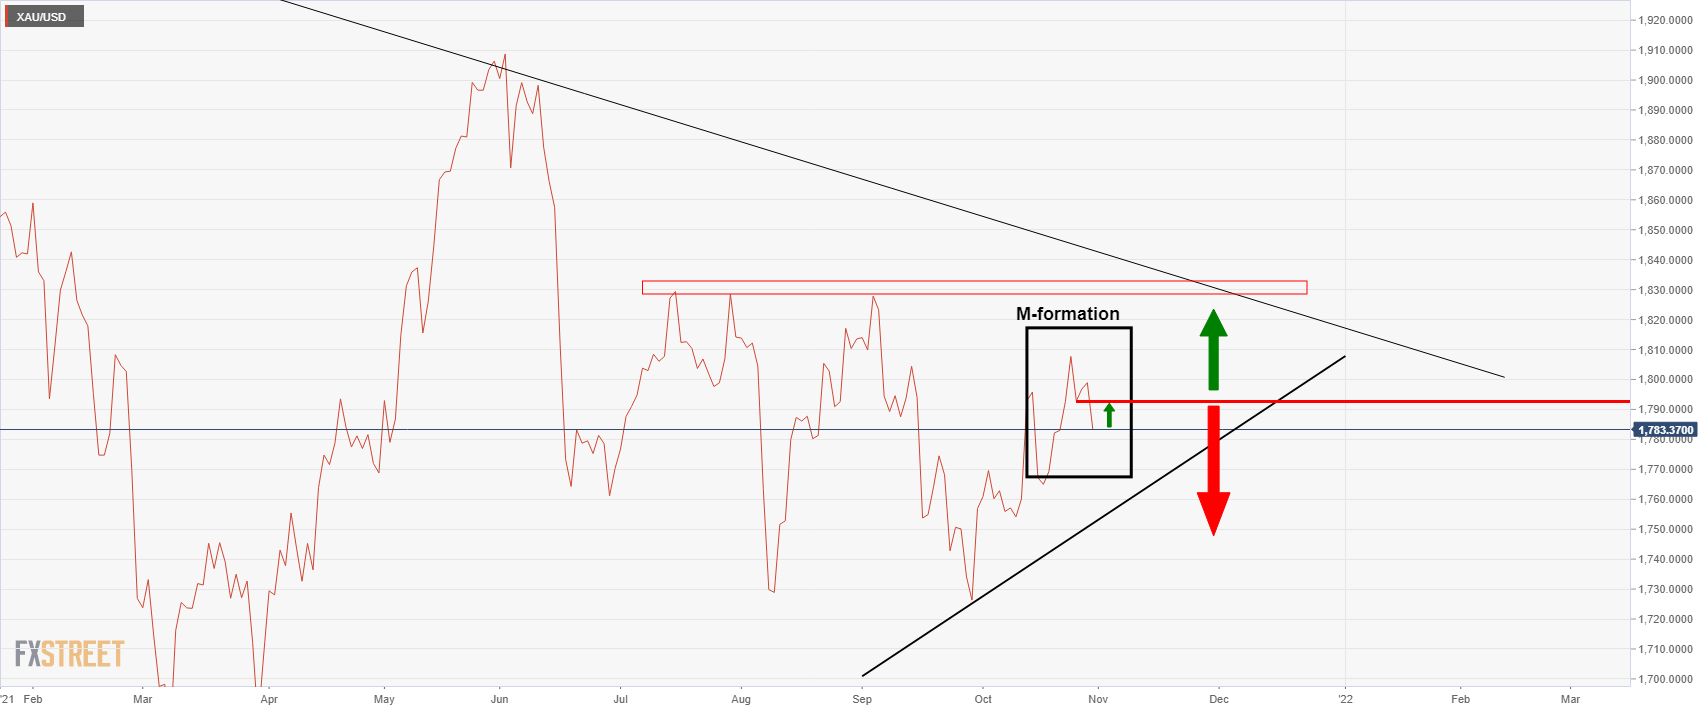
However, given the break of the dynamic support on the candlestick chart, there is a compelling argument for a restest of the neckline that also meets what is now considered to be a counter trendline:
Resistance there could lead to a fresh bearish impulse, although this would be expected to take some days to play out, both ways.
Gold's technical conclusion
The outlook is mixed from a longer-term perspective, although the lower term charts will start to offer clues as to which way to skin the proverbial cat.
From a 4-hour basis, the bulls are targeting the daily neckline near 1,792 as follows:
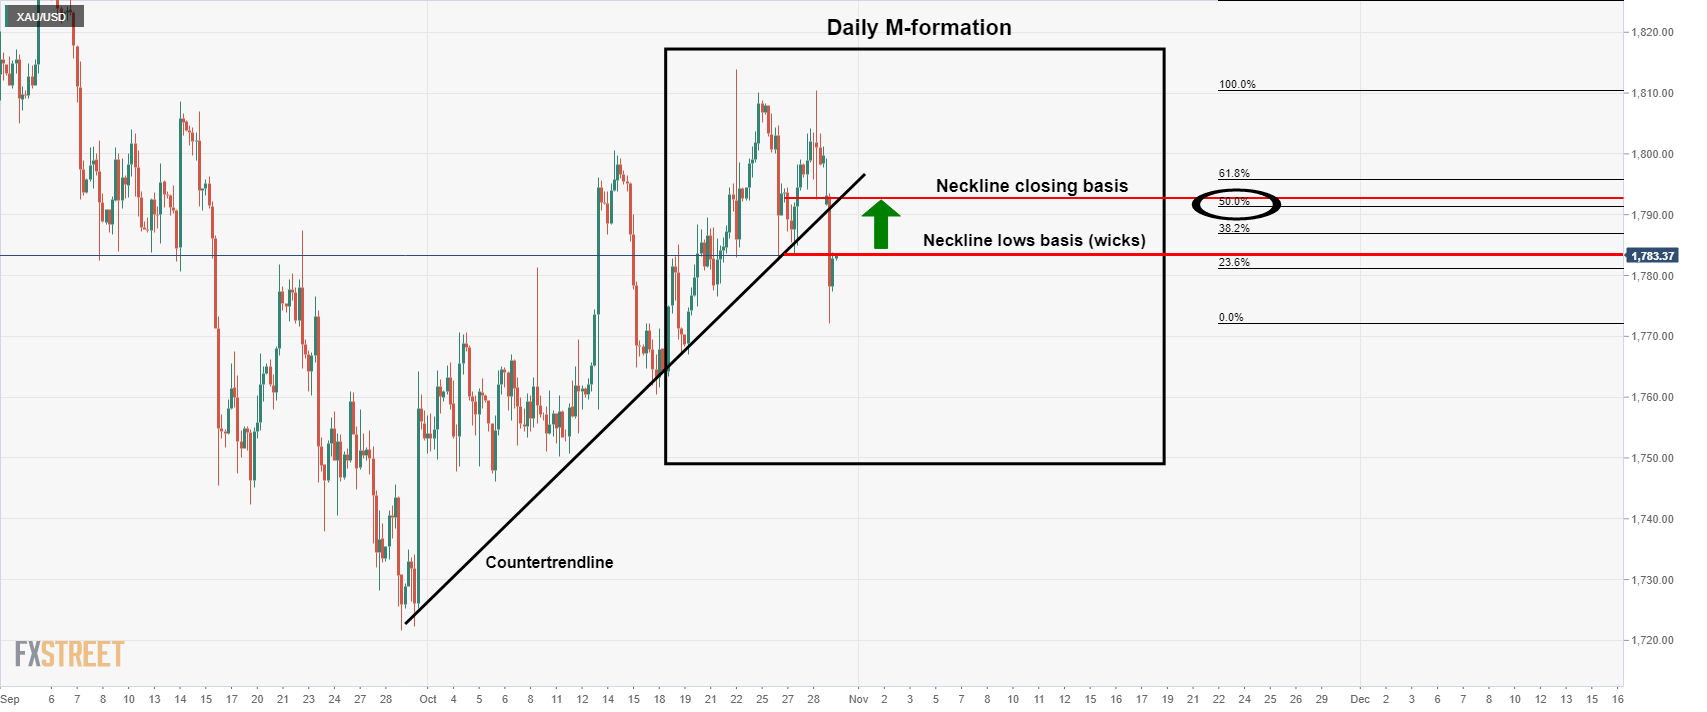
The price has moved into the wicks of the M-formation's neckline already which would be expected to act as resistance, but eventually, give way to the neckline on a closing basis, (the lows of the bodies of the candles), for there is a better confluence with the 50% mean reversion point of the latest daily bearish impulse.
Gold H1 chart
With that being said, day traders should also be aware of the scalping opportunity from an hourly basis that could arise at this level of current resistance as follows:
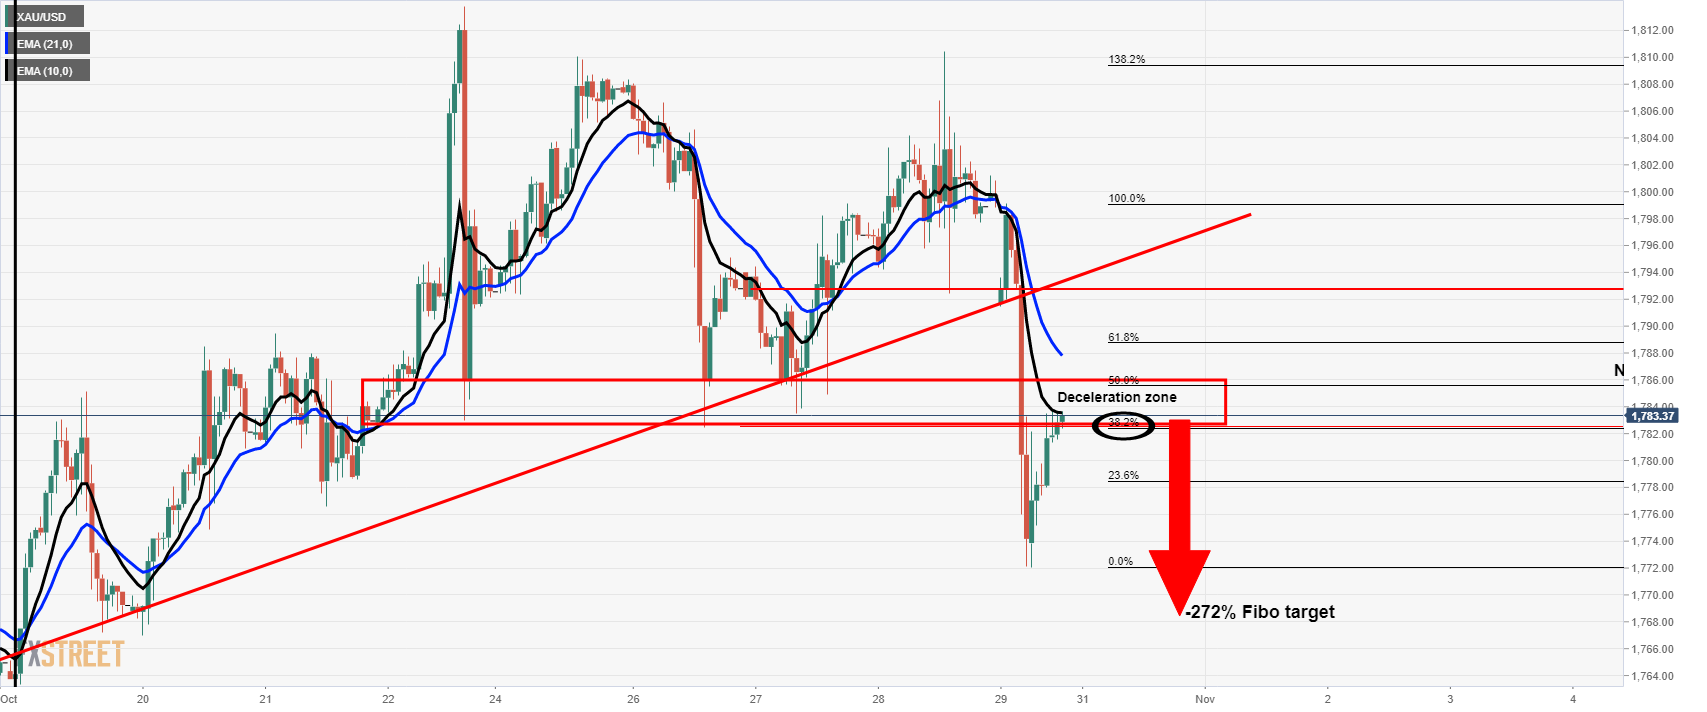
The bears will be looking for the price to decelerate within this current correction that has already met a 38.2% Fibonacci retracement level and the wicks of the daily M-formation's neckline as confluence. Should the resistance hold, there will be prospects of a high probability short set up to target a downside hourly impulse to at least test the -272% Fibonacci retracement of the correction's current range. This comes in near to 1,768 currently.
Premium
You have reached your limit of 3 free articles for this month.
Start your subscription and get access to all our original articles.
Author

Ross J Burland
FXStreet
Ross J Burland, born in England, UK, is a sportsman at heart. He played Rugby and Judo for his county, Kent and the South East of England Rugby team.


