Chart of the Week: Gold bears lurk at weekly trend line resistance
- The price is testing weekly support and bearish commitments in the $1,800s.
- A break of $1,750 opens risk toward March highs near $1,644.

The price of gold has been supported by a dynamic weekly/daily trend line where bulls consolidated and finally made a break for the upside in the latter part of the week. The price moved into the $1,800s but has failed to take out the weekly trend line resistance so far. The following illustrates the possible trajectories for the week ahead:
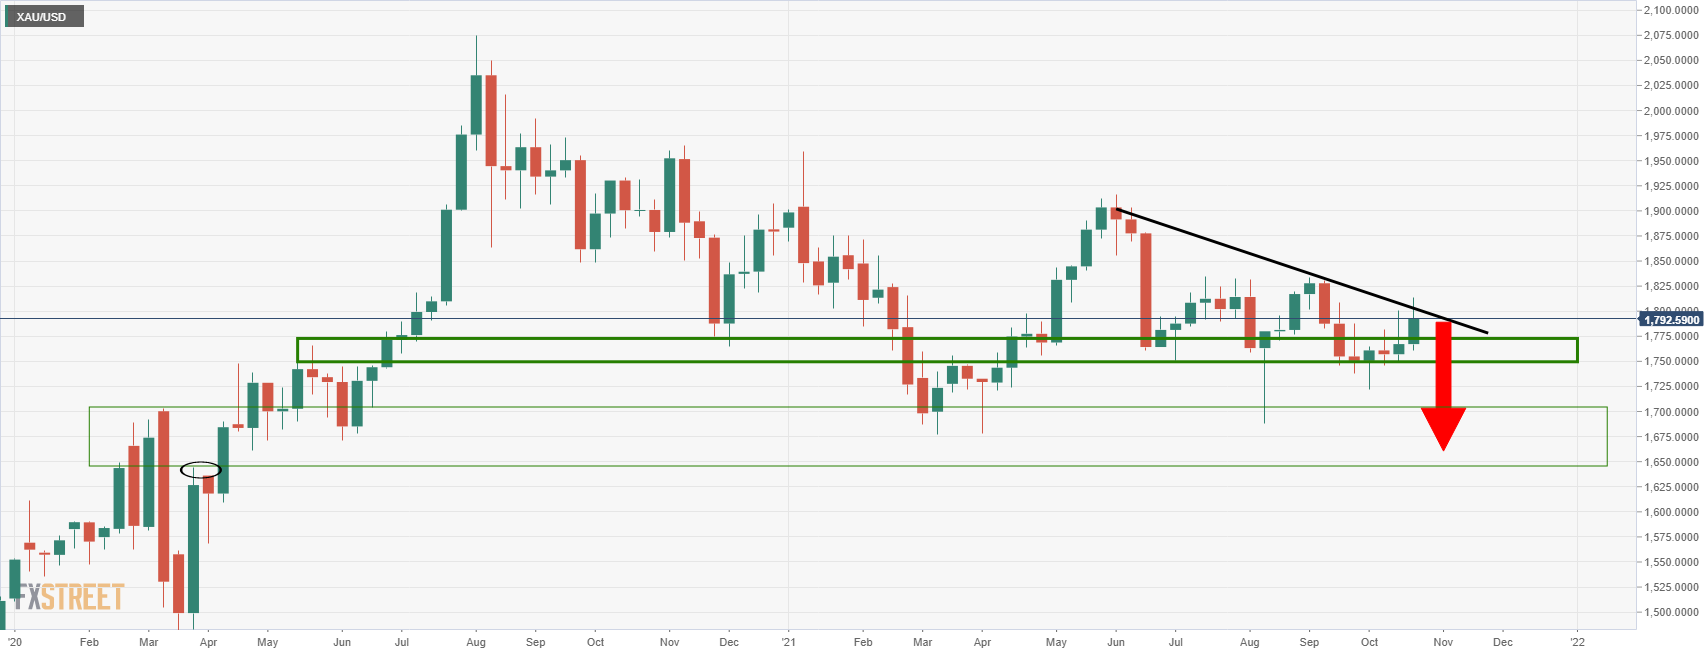
Gold weekly chart
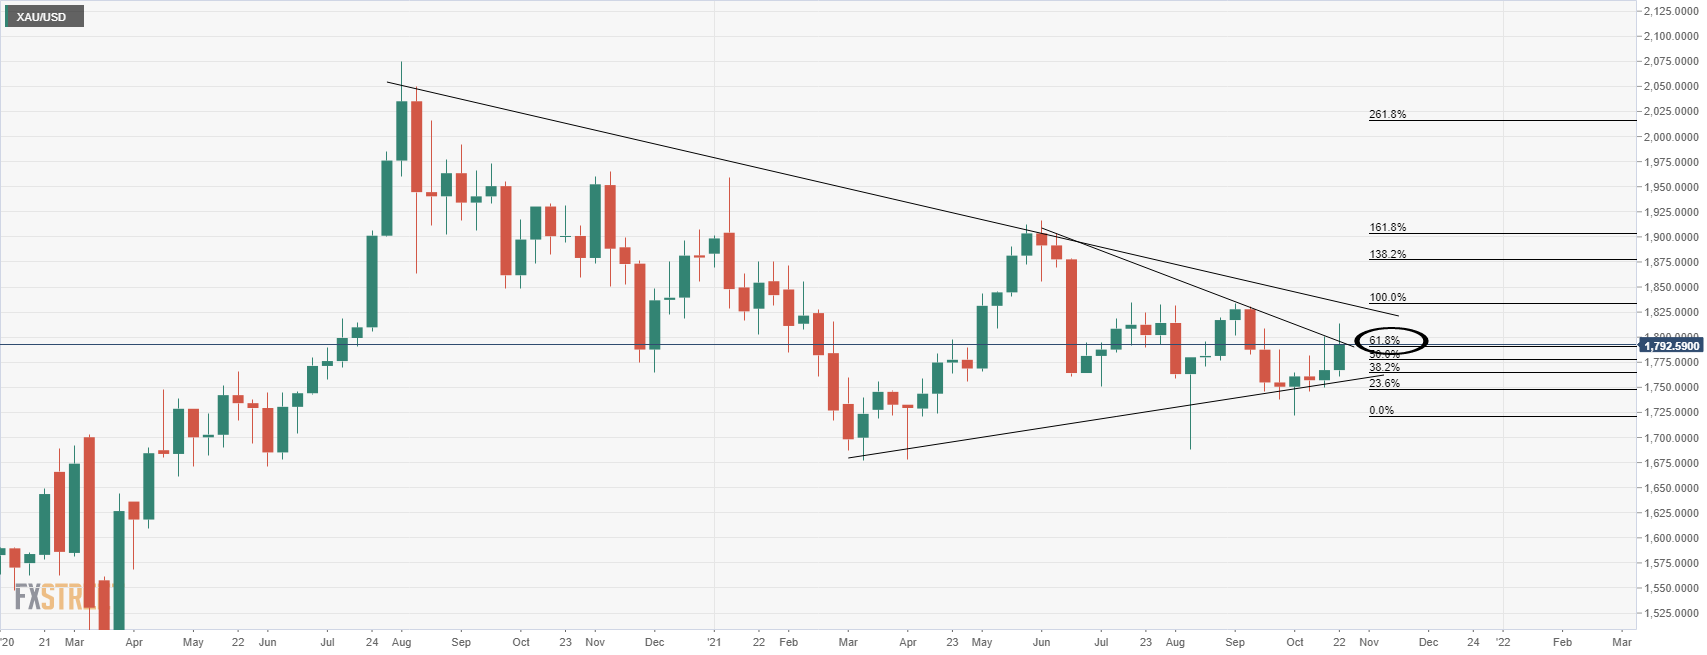
The weekly chart shows the price testing fresh dynamic resistance in what has been a 61.8% Fibonacci retracement of the prior weekly bearish impulse, which could equate to firm resistance. In doing so, the price would be expected to extend to the downside, in line with the dominant weekly trend and to test weekly horizontal support en-route to $1,650 and near to March 2020 highs:
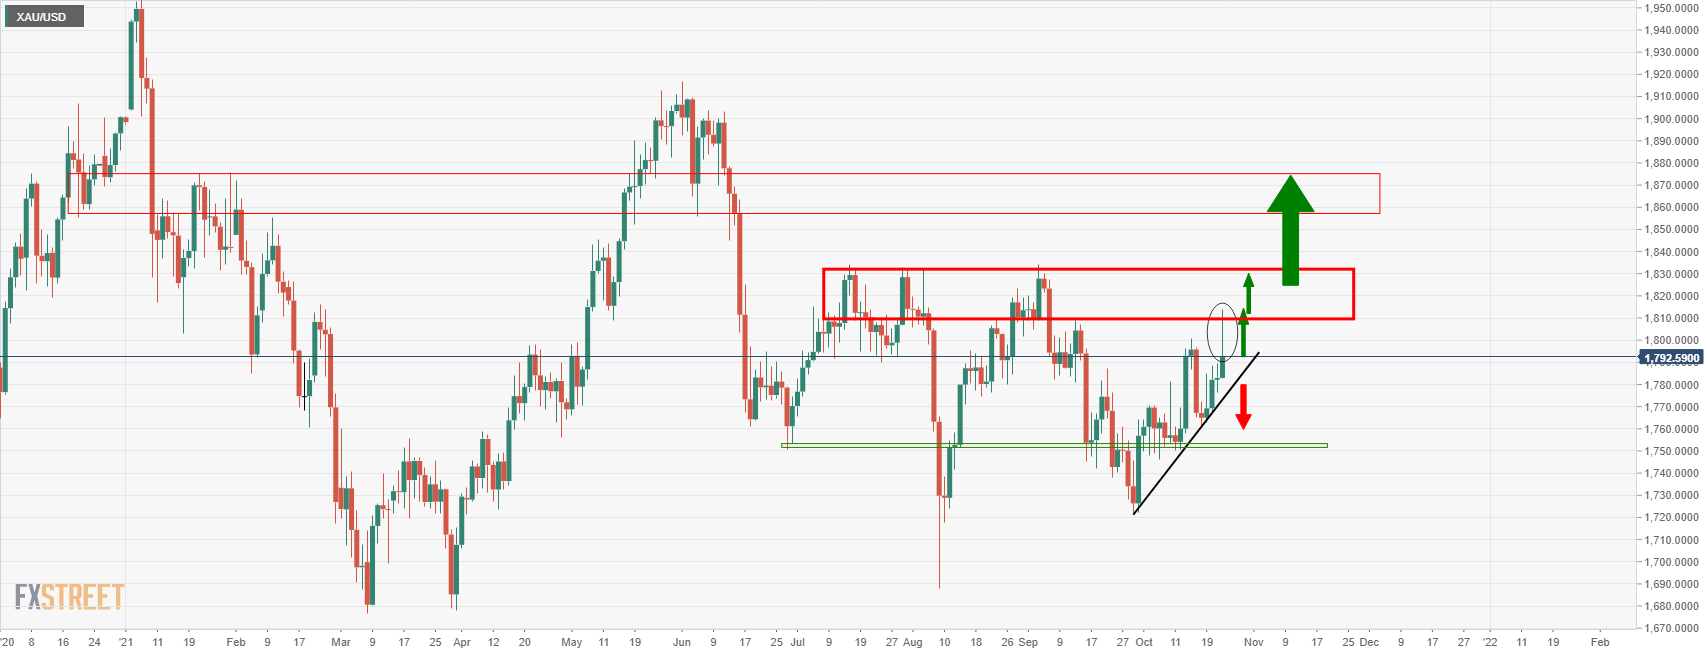
Gold daily charts
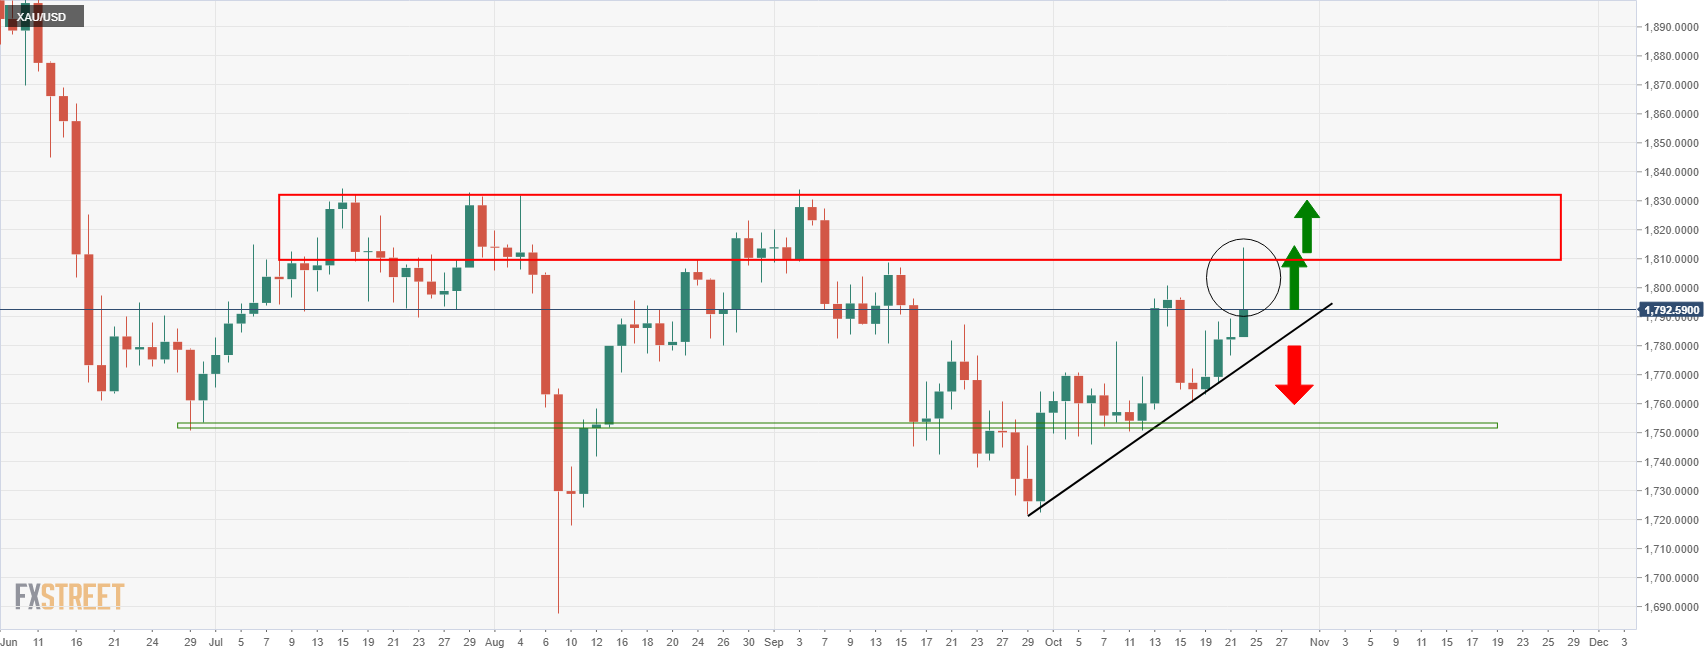
From a daily perspective, the price is attempting a move higher, as Friday's price action shows, and the wick's high of the candle is a likely target for the sessions ahead. $1,835 guards territory to $1,880 as follows:
Premium
You have reached your limit of 3 free articles for this month.
Start your subscription and get access to all our original articles.
Author

Ross J Burland
FXStreet
Ross J Burland, born in England, UK, is a sportsman at heart. He played Rugby and Judo for his county, Kent and the South East of England Rugby team.


