Gold builds ABCDE triangle pattern for bullish breakout

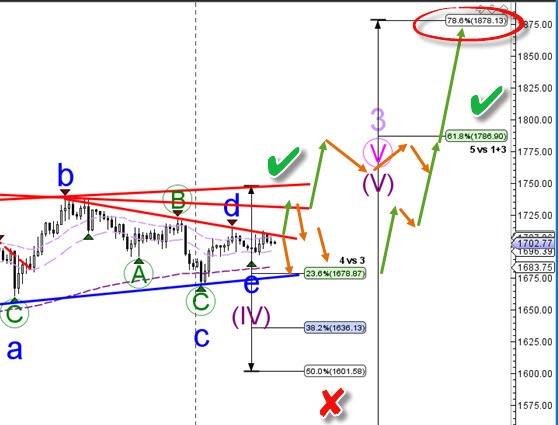
XAU/USD (Gold) is moving sideways in a triangle chart pattern. The ABCDE waves (blue) are expected to be completed soon.
4 hour chart
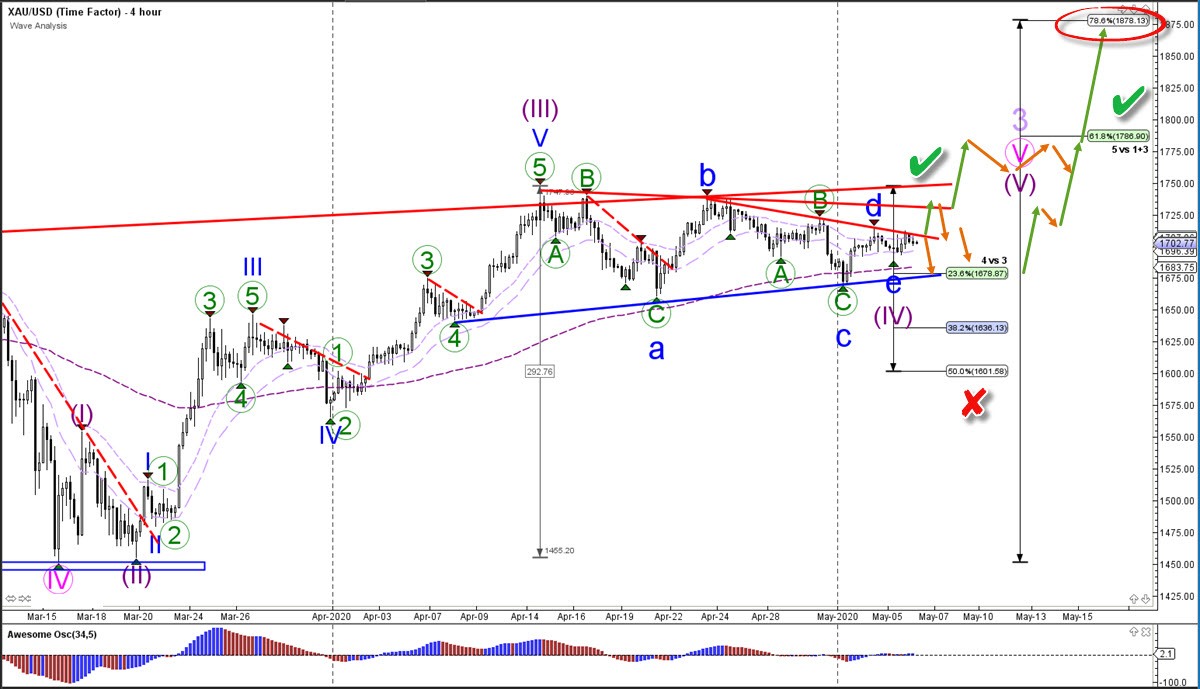
The XAU/USD (blue) could be in the final wave E (blue). Although it’s possible the price will still extend the wave D (blue) at the resistance trend line (red) and the wave E at support. The ABCDE triangle is part of a wave 4 (purple) correction. This in turn is indicating an uptrend and a continuation of wave 5 (purple) within wave 3 (purple).
The bullish target is the 78.6% Fibonacci level of wave 5 vs 1+3. Price needs to break above the resistance trend lines (red) first before a new bullish swing could take place. A break below the 50% Fib invalidates the bullish outlook.
The analysis has been done with the CAMMACD.Core System.
For more daily technical and wave analysis and updates, sign-up up to our ecs.LIVE channel.
Author

Chris Svorcik
Elite CurrenSea
Experience Chris Svorcik has co-founded Elite CurrenSea in 2014 together with Nenad Kerkez, aka Tarantula FX. Chris is a technical analyst, wave analyst, trader, writer, educator, webinar speaker, and seminar speaker of the financial markets.


