Gold at possible resistance/bearish turn - Elliott wave analysis
Hello traders,
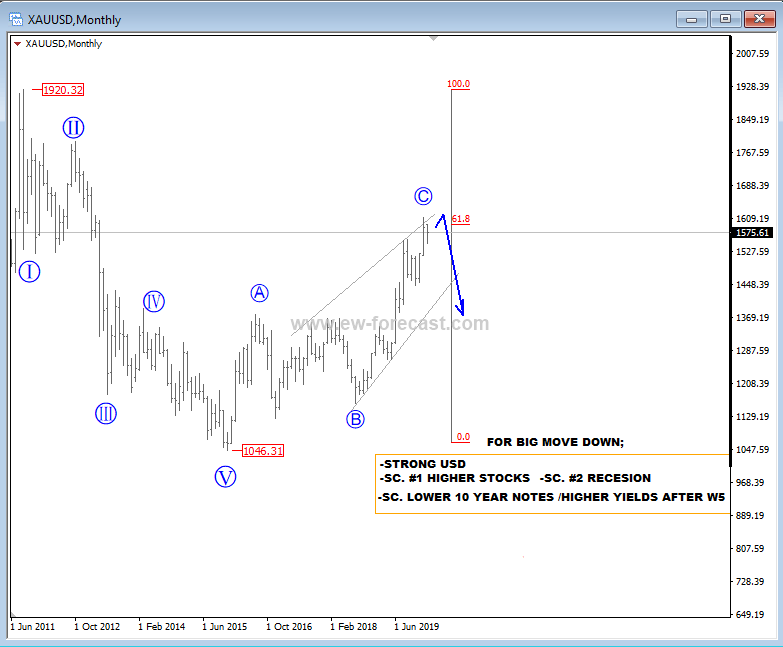
On the monthly chart of GOLD we see price at the end of a bigger A-B-C correction, which followed as a contra-trend reaction the the previous five-wave fall. Ideally some resistance and a bearish turn can be seen here around the Fib. ratio of 61.8 (1600/1620 region), where bears can again turn price lower.
Gold, Monthly
You can subscribe to our webpage at EW-Forecast for more unique, and daily content. We also have a 7-day trial offer for FX services (1€) and for Crypto services (2€). Check it out!
Author

Gregor Horvat
Wavetraders
Experience Grega is based in Slovenia and has been in the Forex market since 2003.
More from Gregor Horvat


