Gold assumes a recession is bullish – It’s not

With the PMs outperforming on Apr. 20 despite the S&P 500’s struggles, the crowd continues to assume that what’s bad for other risk assets is good for gold, silver and mining stocks. However, reality paints a much different portrait, and the PMs’ medium-term outlooks are fraught with peril.
During the last three recessions – the dot-com bubble, the global financial crisis (GFC) and the COVID-19 pandemic – the yellow metal declined materially from its pre-crisis highs. And since mining stocks and silver are often more volatile than gold, their recessionary drawdowns are often worse.
Therefore, since rising interest rates and quantitative tightening (QT) are only one-half of our bearish thesis, the next phase is a recession that pushes risk assets to their final lows. And with the bond market already signaling an economic collapse is the only way to win the inflation war, it’s likely only a matter of time before the drama unfolds.
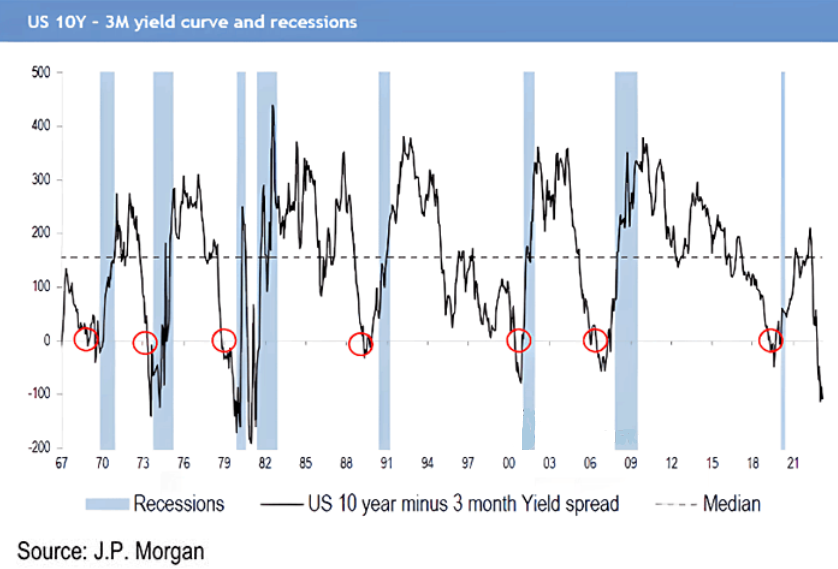
To explain, the black line above subtracts the 3-month T-Bill yield from the U.S. 10-Year Treasury yield. When the spread is negative, it means the short end of the curve is pricing in a more hawkish Fed, while the long end of the curve is pricing in the economic destruction that comes after.
If you analyze the red circles, you can see that when the spread turns negative, it has a perfect track record of predicting recessions. More importantly, the current 10Y-3M spread on the right side of the chart is deeply negative, which rivals the 1970s/1980s when inflation was also highly problematic. As such, when panic erupts, don’t be surprised if the PMs are caught in the crossfire.
In addition, The Conference Board released its Leading Economic Index (LEI) on Apr. 20. The metric declined by 1.2% in March, and is down by 4.5% over the last six months. Justyna Zabinska-La Monica, Senior Manager of Business Cycle Indicators at The Conference Board, said:
“The U.S. LEI fell to its lowest level since November of 2020, consistent with worsening economic conditions ahead. The weaknesses among the index’s components were widespread in March and have been so over the past six months, which pushed the growth rate of the LEI deeper into negative territory…..
“The Conference Board forecasts that economic weakness will intensify and spread more widely throughout the US economy over the coming months, leading to a recession starting in mid-2023.”
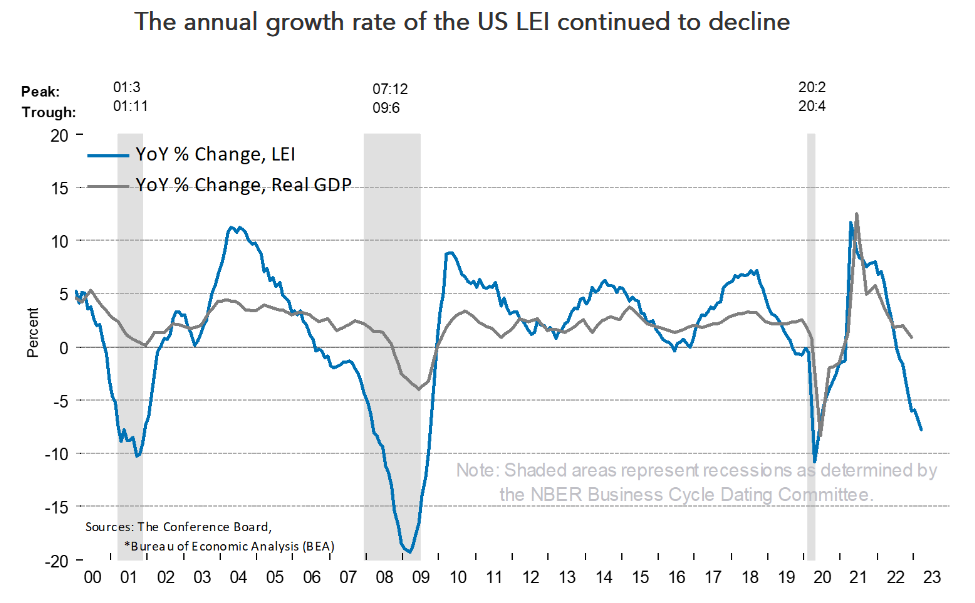
To explain, the blue line above tracks the year-over-year (YoY) percentage change in The Conference Board’s LEI, while the gray line above tracks the YoY percentage change in real U.S. GDP.
If you analyze the relationship, you can see that when the LEI posted similar YoY readings in 2001, 2007/2008 and 2020, the U.S. slipped into recession. And with the PMs suffering profound drawdowns during these events, their price action contrasts the fundamental turning points that lie ahead.
Likewise, while the Fed confronts a precarious economic backdrop, inflation has not been remedied.
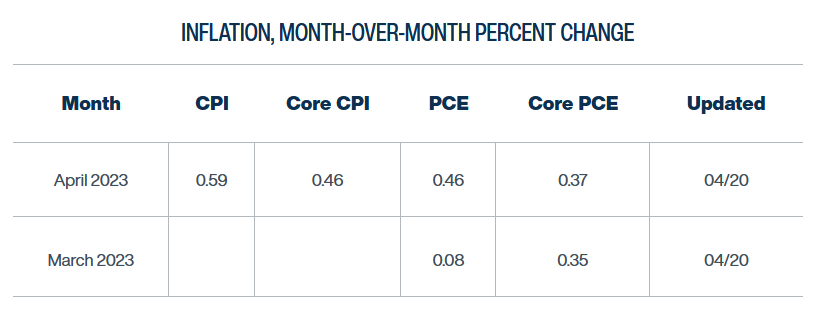
To explain, the Cleveland Fed projects the headline and core Consumer Price Indexes (CPIs) will rise by 0.59% and 0.46% month-over-month (MoM) in April. And while its headline CPI forecasts have been off recently, its core CPI assumptions have been accurate. Therefore, with 0.46% MoM annualizing to 5.66% YoY, resilient inflation is still a major problem.
Finally, please remember that the U.S. federal funds rate (FFR) has eclipsed the peak YoY core CPI in every cycle since the 1950s. And with the latter peaking (for now) at 6.64%, history suggests the Fed is far from winning this war.
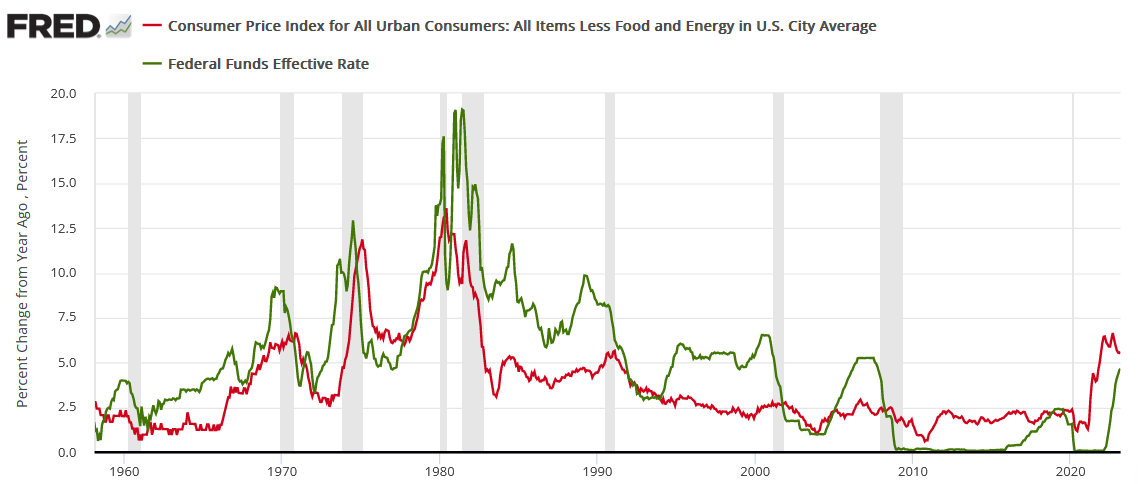
Also, please note how the YoY core CPI (the red line) continued to rise during every recession except for 1960 and 2008. This makes the economic backdrop even more ominous, and investors are kidding themselves if they think a soft landing is on the horizon.
Overall, we don’t see signs of a PM bull market, as the positives of rate cuts and QE only come after the negatives of economic devastation. Moreover, not only do the bullish assumptions defy logic, but they contrast economic and financial-market history. As such, profound wake-up calls should emerge in the months ahead.
Do you believe a recession is bullish for the PMs?
Want free follow-ups to the above article and details not available to 99%+ investors? Sign up to our free newsletter today!
Want free follow-ups to the above article and details not available to 99%+ investors? Sign up to our free newsletter today!
Author

Sébastien Bischeri
Sunshine Profits
Sebastien Bischeri is a former Reserve Officer in the French Armed Forces (Navy), and began his career in computer science and engineering, prior to move into banking, finance, and trading.


