Gold and WTI Crude remain in sideways consolidation patterns

Gold
-
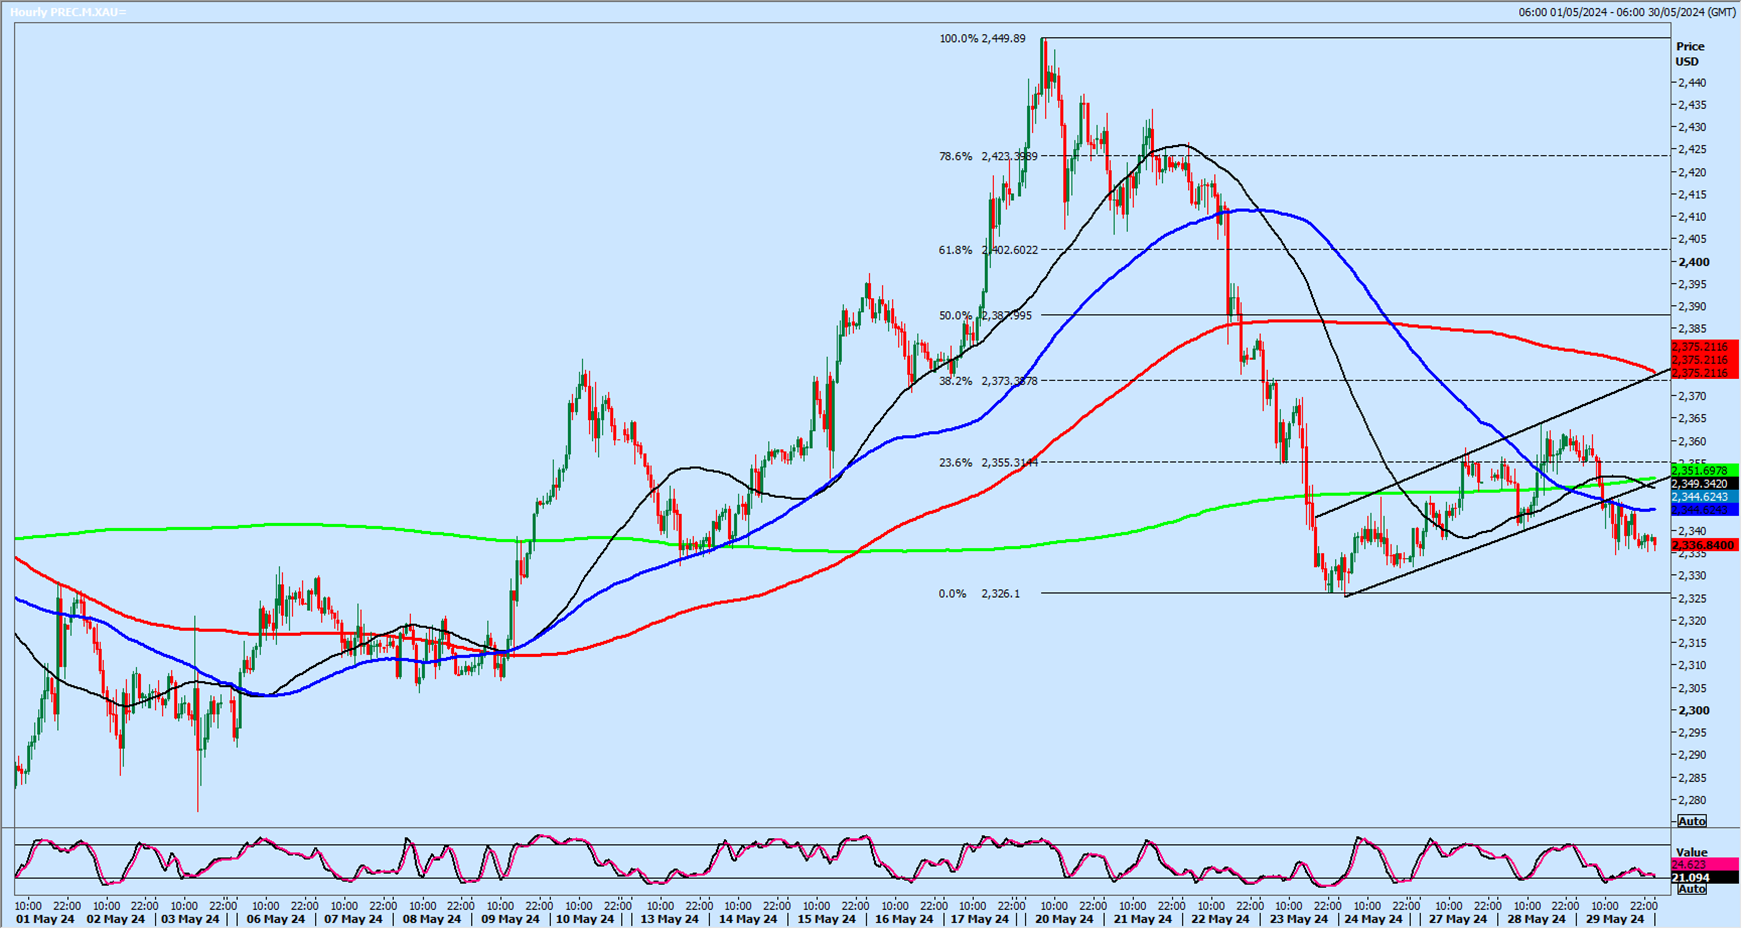
Gold volatility has dropped significant as we are in a sideways consolidation at this stage. After last week's bearish engulfing candle on the weekly chart, I warned that this would happen, but it takes a couple of weeks before we can try to identify the consolidation pattern. Is it a triangle, channel, pennant, flag etc? In the meantime, I will do my best to guess the likely high & low for the day to try to find trade opportunities where we can risk 5 points in the hope of making 10. Unfortunately, I cannot make the market move, so this is the best we can do in these conditions.
-
There could be resistance at 2350/55 this morning & shorts need stops above 2360. Target is 2340.
-
I would try a short again at 2375/80 (if we reach that far today)- stop above 2385. Targets: 2365, 2355
-
A break higher however can be taken as a short-term buy signal targeting 2407/10.
-
Holding below 2335 keeps the pressure to the downside for today targeting 2328/25 (which I do NOT see as a support so i do not suggest trying a long). A break below 2321 should be a sell signal targeting 2309/06.
Silver
-
Silver continues to outperform Gold as expected as we target 3210/20 & a retest of the high at 3250.
-
A break above here is also expected eventually (and could do so even if Gold is unable to follow), although I have no idea of timing. If seen, look for targets of 3275, 3295/99 & eventually 3345/65.
-
First support at 3110/3090 & longs need stops below 3070.
-
A break lower risks a slide to a buying opportunity at 3010/2990 & longs need stops below 2970.
WTI Crude July future
-
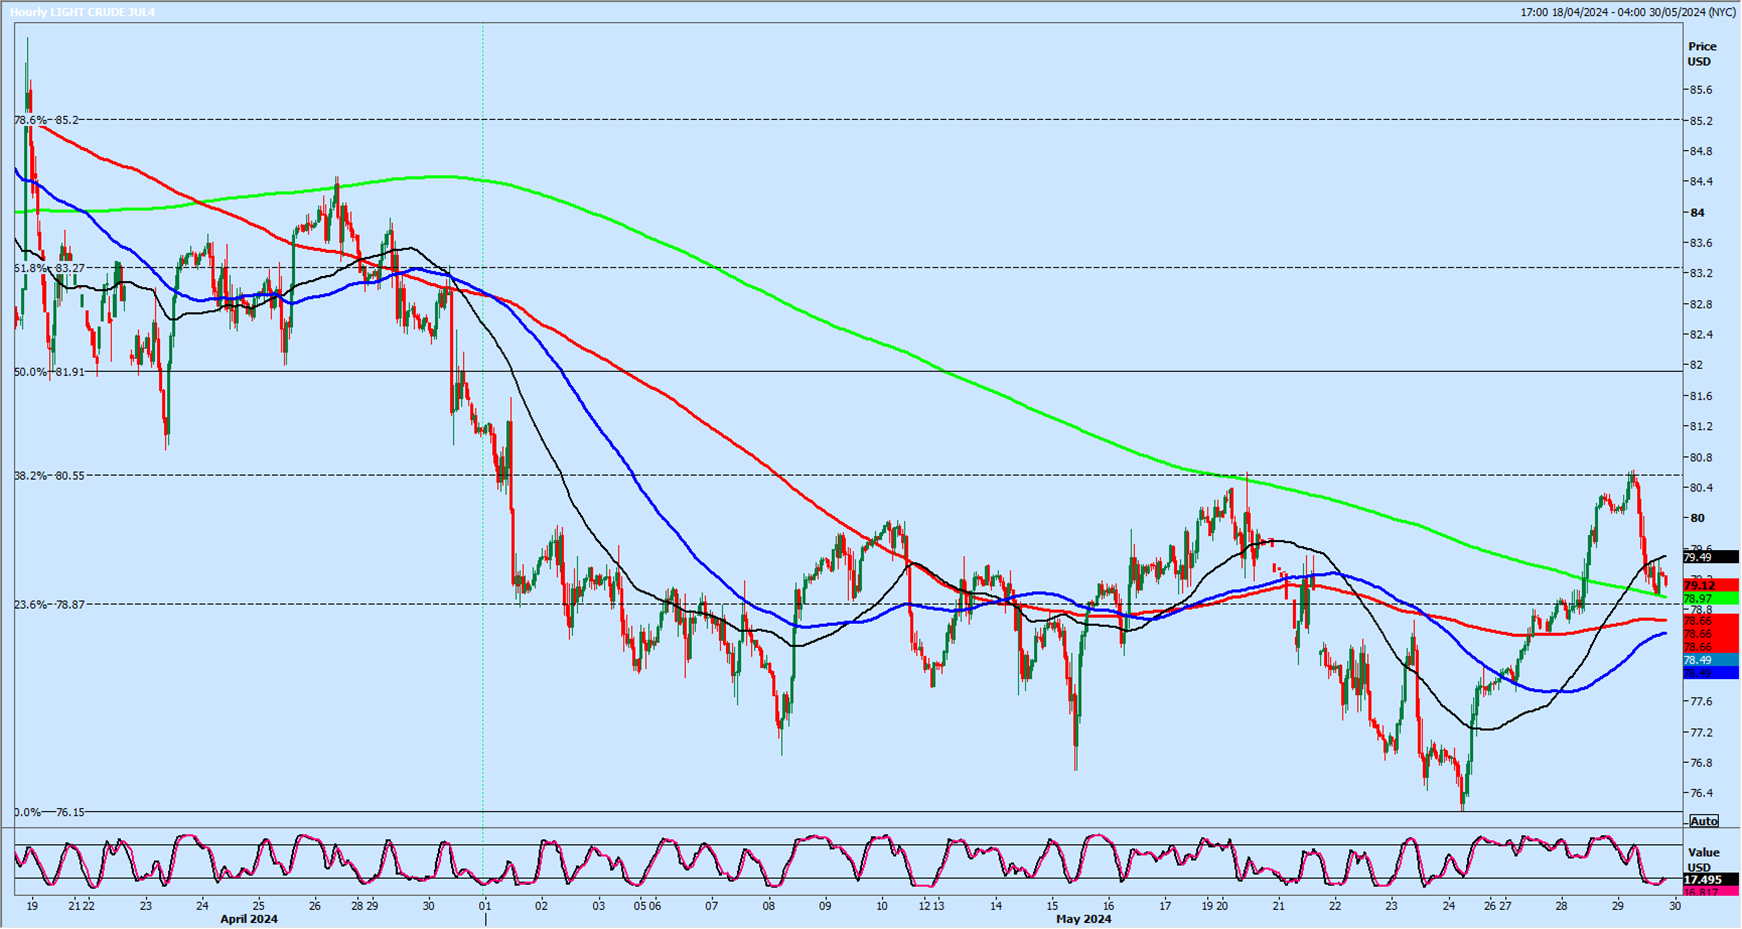
WTI Crude July break above 7930 was a buy signal targeting 8000/8010, which was hit immediately.
-
WTI Crude then collapsed from last week's high at 8060 back to support at 7900/7860 & longs here need stops below 7820.
-
Just be aware that a break above 8080 could be a buy signal for today targeting 8100 & resistance at 8150/70, where a high for the day looks likely.
-
Just so you can calculate the spread for the Oil contract on your platform, the futures on Tuesday had a low at 7899 & a high at 8062.
Gold broke to the downside of what was probably a bear flag at around 10 am UK time.
This should have been a sell signal but unfortunately there was little follow through & we only reached 2335, before trading in a 10 point sideways range ever since.
WTI Crude jumping up and down but going nowhere & currently trading mid range, at the same prices as the beginning of May - so in effect we have gone nowhere!
The 1-month range is only about 450 ticks.
Author

Jason Sen
DayTradeIdeas.co.uk


