Gold and T-Bond Yields Rising as Expected

Three trends I’ve been forecasting have been happening in the last year:
- The strong Trump rally.
- Rising 10-year Treasury bond yields.
- And rising gold prices.
They’re all related to late stage inflation and the expected tax cuts, which have materialized.
One thing that still hasn’t happened, and still doesn’t look imminent yet, is the bursting of this increasingly parabolic stock bubble.
Hard for that to happen when we’ve had the QE free lunch for so long, and now the large tax cuts to corporations.
GDP growth seems to be picking up, but not as much as expected. The fourth quarter reading came in at 2.6% instead of the expected 3.0%-plus. The full 2017 reading was 2.3%, just marginally higher than past years that have averaged 2%.
Rising growth suggests rising inflation and rising inflation means higher T-bond yields, which have already been the case as the chart shows.
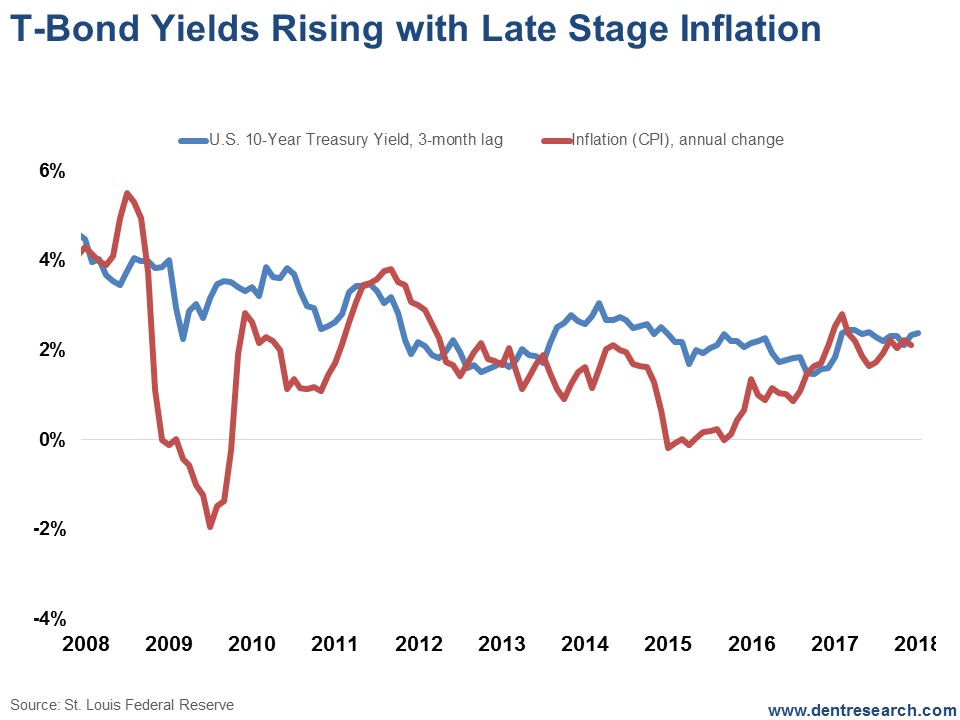
I have also been warning that inflation is a lagging indicator.
The last recession saw inflation rise in the first several months – and T-Bond yields with it – before coming down into late 2008/early 2009. This is typical and comes from rising wages with tighter labor availability and rising commodity prices in the late stages of a boom.
On a related note, I’ve been expecting a substantial gold rally – but not a new bull market for the commodity – from the extreme oversold reaction into the end of 2015, when gold hit $1,050 from an all-time high of $1,934 in September 2011.
Look at this next chart…
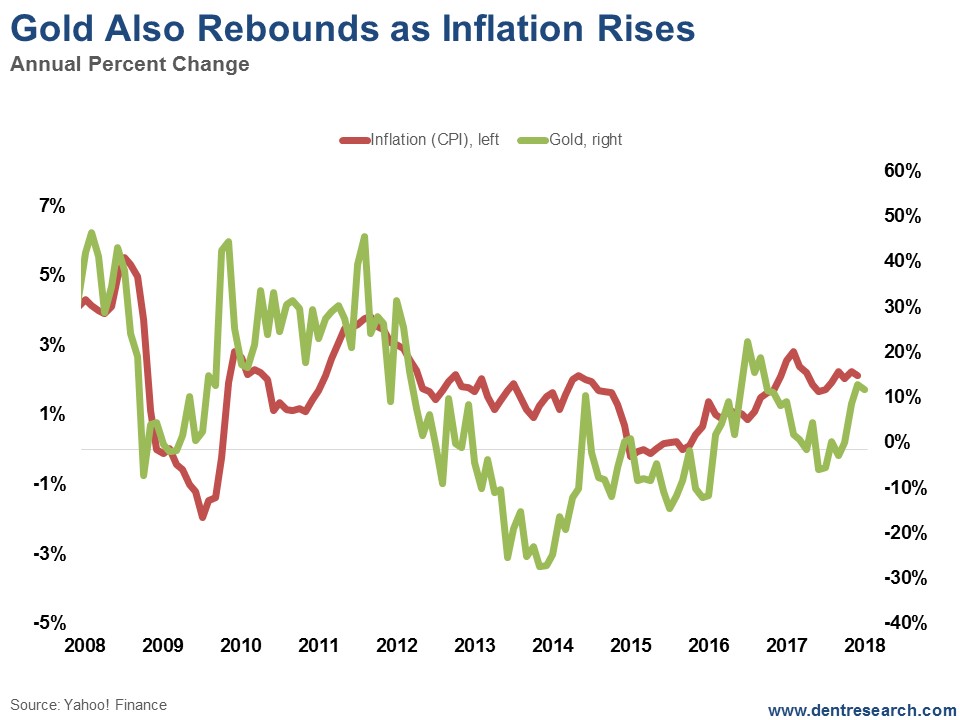
ote that this chart is the annualized percentage change in gold to correlate with the percentage rate of inflation.
Gold is more of an inflation hedge, than a crisis hedge.
It crashed 33% in the midst of the Lehman Brothers meltdown, while silver was down 50%.
With this trend of mildly rising inflation, gold prices and T-bond yields will likely continue moving upward until there are signs of an economic slowdown and/or a bubble burst in stocks. Then deflation will set in, as occurred briefly in late 2008.
The T-Bond channel I’m watching closely has a strong resistance around 3.0% yields – which was the previous high in December 2013 – and we are getting close, at 2.73% on Monday, January 29.
If we break strongly above that, then we are in a new ball game that would be very bad for stocks and real estate.
Gold has resistance at the last major high around $1,375, and the high before that, at around $1,428, is the other strong point of resistance. That’s the range I’ve been forecasting in the last year or so.
Rising T-Bond Yields aren’t good for stock or real estate valuations. Will 3.0% start to be that point? We may find out soon enough.
I see 3.0% as the opportunity to buy long-term Treasurys (30-year are the best) to lock in higher yields and play the inevitable deflation trends ahead when this bubble finally bursts.
And I see the $1,375 to $1,400 area as the opportunity for people who didn’t get out of gold in 2011 when we warned to finally take your money and run.
Author

Harry S. Dent, MBA
Dent Research
Harry S. Dent Jr. studied economics in college in the ’70s, but found it vague and inconclusive. He became so disillusioned by the state of his chosen profession that he turned his back on it.


