Getting on Board the Silver Express

Over the last half year or so, a number of analysts, well-heeled individuals, and mega-hedge fund managers have been taking a shine to silver. So far the "restless metal" hasn't been letting on that it's noticed.
It's understandable why someone who either has not yet begun to commit funds to building a physical silver position – or who has not completed his or her ownership program – might think it best to wait and see if the price starts rising, thus validating the silver bulls' call. But this kind of strategy could end up being a big financial mistake on several counts.
And worse yet, Mr. Market could decide to whisk away today's prices – and the relative availability of investment grade silver – to the point that you'll never even take a position at all.
To get a sense of how you might feel as you watch, and watch, and watch while silver makes its long overdue, third, and almost certainly largest levitation toward the ultimate high since the start of its rise in 2001, please examine the palladium chart below.
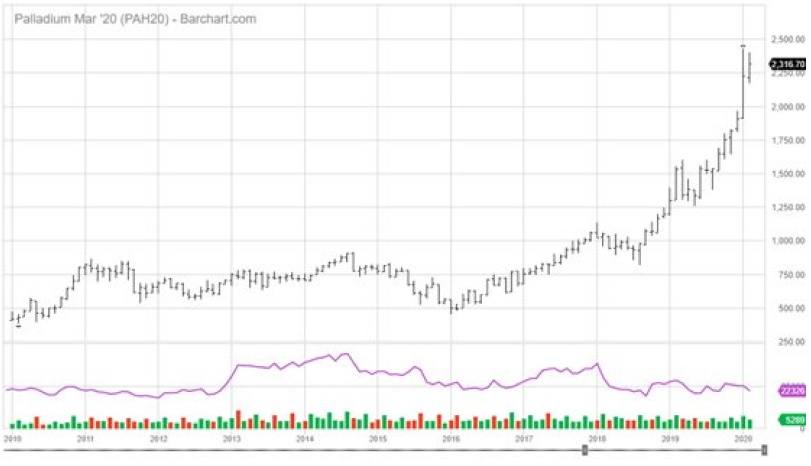
10 Year Monthly Palladium
After spending 5 years in a $300 price range, palladium decided in December 2016 to put in a long-term bottom around the time that gold and silver were doing something similar.
Then, again like gold and silver at the time, it rallied, moving to a several years' high around $850... but kept on going. Gold and silver faded away for the next 18 months, putting in a double bottom in late 2018.
By the way, during this entire time, David Morgan, provided guidance for his subscribers – be they holders of The Morgan Report Premium, Mastermind, or Insiders' Memberships – in how to profitably trade these multiple hundred-dollar swings via futures, options, stocks, or physical palladium rounds and bullion itself.
Given David Morgan's expertise in these areas, look to him being able to effectively help current and new subscribers alike do the same thing with the coming explosive upside run in silver and gold.
In January 2018, palladium seemed to build out a major top around $1,150 – almost exactly where it had done so twenty years before! Just about everyone (me included) watched with trepidation as that level once again turned back prices and the metal declined by over $300.
What happened next will be something chartists ponder for a long time to come. Within a matter of months, palladium proceeded to easily punch through that old $1,150 "top"... and to this day, almost 18 months later – continues to rise, seldom pausing, to, at this writing over $2,550... more than twice as high as it had ever traded before!
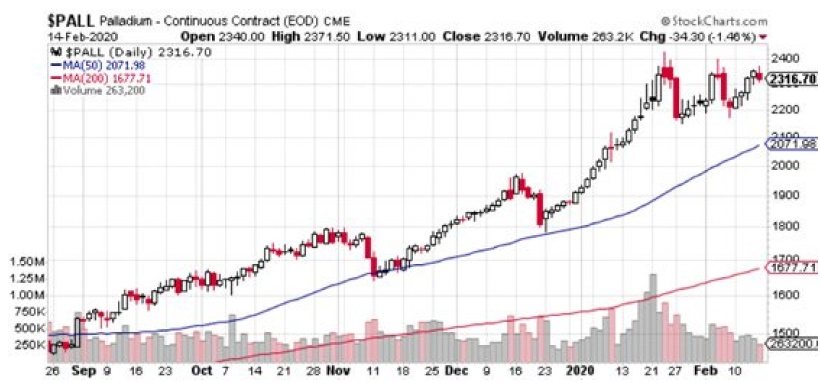
Daily $Palladium
Now look at the nearby daily palladium chart. Do you think it would have been easy to "take a profit" – just about anywhere along the way?
On the other side of the coin, how many people who sold out around $1,000 ever got back on to experience any of this relentless additional $1,450 "profit launch"? More than likely, very, very few.
Silver's Supply-Demand Metrics look to be building the same fundamental – and technical picture as palladium.
For several years, analysts warned of a coming shortage and price spike for palladium.
With silver coming off its fourth consecutive year of lower production in most of the big mining camps and robust Chindian, Eurozone, and now North American demand, silver's building mirror image behavior to that of palladium looks more and more likely.
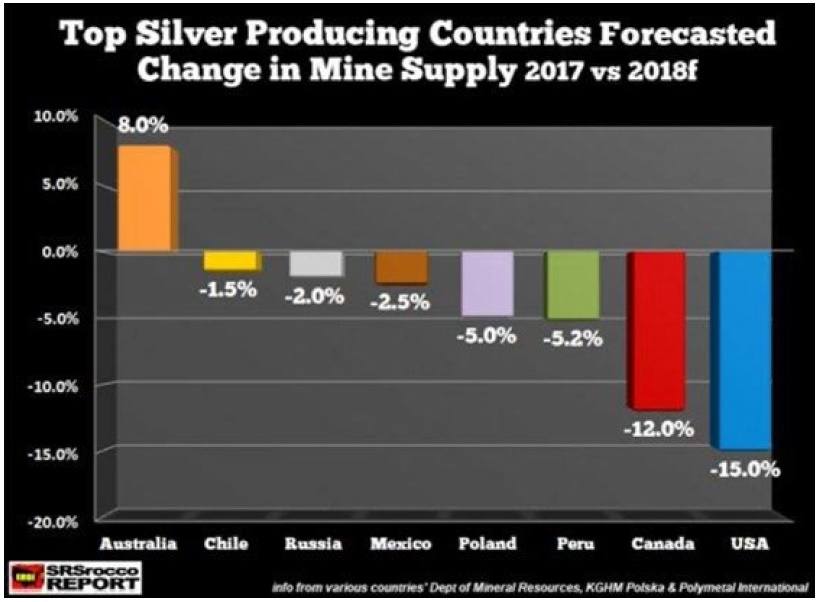
The top 10 silver producing countries are Peru, Bolivia, Australia, Argentina, Mexico, Chile, Poland, China, Russia and Guatemala. And get this... in nine of these countries, silver production has been falling for the past 4 consecutive years!
Rounding out the picture are these salient demand factors.
-
Supply from scrap sources is at a 20-year low.
-
Silver fabrication (manufacturing) demand is just below record levels.
-
Solar panels' silver demand has risen for 7 straight years (2013- 2019).
-
Primary silver producer grams/ton yield has fallen by 50% in the last decade.
And the demand clincher? About 75% of the world's annual new silver supply comes from base metals' production – copper, lead, and zinc. When, not if, investment demand spikes in competition with industrial needs, there's going to be a problem...
Dr. Peter Megaw, perhaps the person who has discovered more high-grade silver deposits than anyone else on the planet, puts it this way:
When the price of silver moves, you can't ratchet up the production from the world's largest gold, copper and lead-zinc mines to pick up more silver. The only place you have to take up the slack on the supply side is [the small number of] primary silver mines.
And don't forget the rising "hidden" costs you'll pay, the longer you wait. Higher prices, and demand outstripping supply, both increase the premium (charge above spot).
In the case of American Silver Eagles, seigniorage – what it costs the U.S. Mint to produce a coin – has already risen by 50% in the last decade, so you can be sure this seldom-considered price factor will continue rising too.
Jeff Clark, one of the best-informed and most articulate analysts in the space, calls the current silver price "A bottle rocket awaiting liftoff."
To receive free commentary and analysis on the gold and silver markets, click here to be added to the Money Metals news service.
Author

David Smith
Money Metals Exchange
















