Geopolitics upsets markets

USD: Sept '24 is Up at 103.000.
Energies: Sept '24 Crude is Down at 79.89.
Financials: The Sept '24 30 Year T-Bond is Down 2 ticks and trading at 123.08.
Indices: The Sept '24 S&P 500 emini ES contract is 37 ticks Higher and trading at 5379.00.
Gold: The Dec'24 Gold contract is trading Down at 2503.00.
Initial conclusion
This is not a correlated market. The USD is Up and Crude is Down which is normal, but the 30 Year T-Bond is trading Down. The Financials should always correlate with the US dollar such that if the dollar is Higher, then the bonds should follow and vice-versa. The S&P is Higher and Crude is trading Lower which is correlated. Gold is trading Lower which is correlated with the US dollar trading Up. I tend to believe that Gold has an inverse relationship with the US Dollar as when the US Dollar is down, Gold tends to rise in value and vice-versa. Think of it as a seesaw, when one is up the other should be down. I point this out to you to make you aware that when we don't have a correlated market, it means something is wrong. As traders you need to be aware of this and proceed with your eyes wide open. Asia traded mainly Higher with the Indian Sensex in negative territory. All of Europe is trading Lower with the exception of the Spanish IBEX exchange at the present time.
Possible challenges to traders
-
NFIB Small Business Index is out at 6 AM EST. This is Major.
-
Core PPI m/m is out at 8:30 AM EST. This is Major.
-
PPI m/m is out at 8:30 AM EST. This is Major.
-
FOMC Member Bostic Speaks at 1:15 PM EST. This is Major.
Traders, please note that we've changed the Bond instrument from the 10 year (ZN) to the 2 year (ZT). They work exactly the same.
We've elected to switch gears a bit and show correlation between the 10-year Treasury notes (ZN) and the S&P futures contract. The YM contract is the Dow Jones Industrial Average, and the purpose is to show reverse correlation between the two instruments. Remember it's likened to a seesaw, when up goes up the other should go down and vice versa.
Yesterday the ZT migrated Higher at around 8:30 AM EST. If you look at the charts below the ZT gave a signal at around 8:30 AM with no real economic news is sight and started its Downward slide. Look at the charts below and you'll see a pattern for both assets. The Dow moved Lower at 8:30 AM and the ZT moved Higher at around the same time. These charts represent the newest version of BarCharts, and I've changed the timeframe to a 15-minute chart to display better. This represented a Long opportunity on the 2-year note, as a trader you could have netted about 40 plus ticks per contract on this trade. Each tick is worth $7.625. Please note: the front month for ZT is Sept and the Dow is now Sept '24. I've changed the format to filled Candlesticks (not hollow) such that it may be more apparent and visible.
Charts courtesy of barcharts
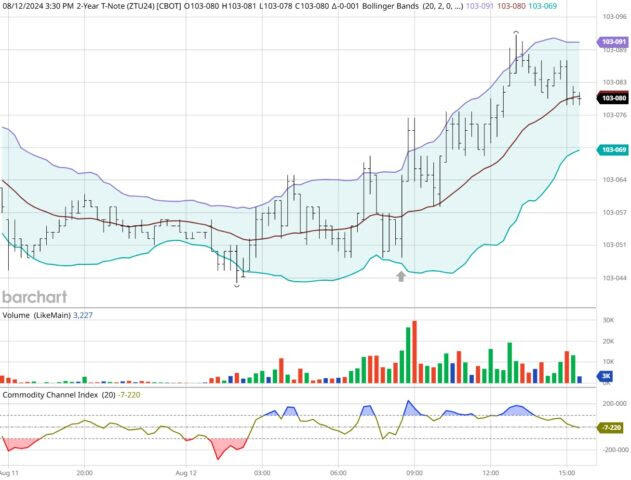
ZT -Sept 2024 - 08/12.24
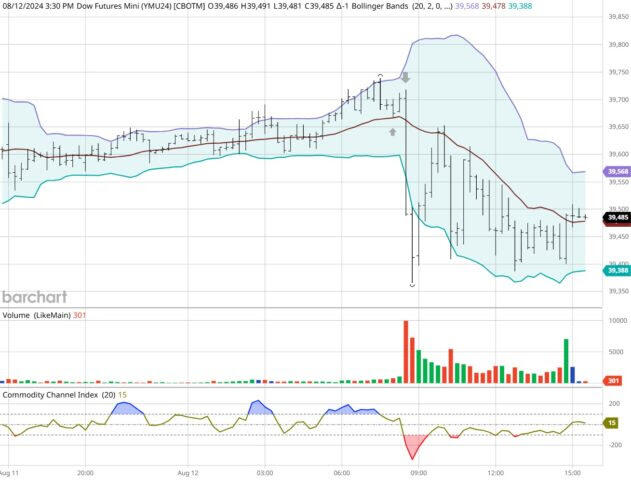
Dow - Sept 2024- 08/12/24
Bias
Yesterday we gave the markets a Neutral or Mixed bias as we didn't see much in the way of Market Correlation Monday morning, The Dow closed 141 points Lower but the S&P and Nasdaq both eked out a gain, though not by much. Today we aren't dealing with a correlated market and our bias is to the Upside.
Could this change? Of Course. Remember anything can happen in a volatile market.
Commentary
Over the weekend as reported by CNN we heard of a possible impending attack on Israel by Iran and Hezbollah. At first glance I paid no attention to it as sometimes rumors fly with no measure of truth. However, as yesterday's session progressed, my understanding is an aircraft carrier, and a submarine were put on High Alert and that is not a joking matter. Both are very lethal if it does come to pass then there could be a major war brewing in the Middle East. The markets as a general doesn't like certainty even though the markets themselves are anything but certain. The CNN report suggested that early this week an attack may be forthcoming. Could this or will this happen?? Remember anything can happen in a volatile market.
Author

Nick Mastrandrea
Market Tea Leaves


