Geopolitics advance, markets drop [Video]
![Geopolitics advance, markets drop [Video]](https://editorial.fxstreet.com/images/TechnicalAnalysis/Intermarket/Correlation/greasy-gears-in-the-machine-gm503847604-82780433.jpg)
US Dollar: Mar '22 USD is Up at 95.835.
Energies: Mar '22 Crude is Down at 84.75.
Financials: The Mar '22 30 Year bond is Up 13 ticks and trading at 156.11.
Indices: The Mar '22 S&P 500 emini ES contract is 72 ticks Lower and trading at 4371.00.
Gold: The Feb'22 Gold contract is trading Up at 1838.40. Gold is 65 ticks Higher than its close.
Initial conclusion
This is not a correlated market. The dollar is Up, and Crude is Down which is normal, and the 30-year Bond is trading Higher. The Financials should always correlate with the US dollar such that if the dollar is lower, then the bonds should follow and vice-versa. The S&P is Lower, and Crude is trading Lower which is not correlated. Gold is trading Higher which is not correlated with the US dollar trading Up. I tend to believe that Gold has an inverse relationship with the US Dollar as when the US Dollar is down, Gold tends to rise in value and vice-versa. Think of it as a seesaw, when one is up the other should be down. I point this out to you to make you aware that when we don't have a correlated market, it means something is wrong. As traders you need to be aware of this and proceed with your eyes wide open. Currently Asia is trading mainly Lower with the exception of the Nikkei and Shanghai exchanges which are Higher. Currently all of Europe is trading Lower.
Possible challenges to traders today
-
Flash Manufacturing PMI is out at 9:45 AM EST. This is Major.
-
Flash Services PMI at 9:45 AM EST. This is Major.
Treasuries
Traders, please note that we've changed the Bond instrument from the 30 year (ZB) to the 10 year (ZN). They work exactly the same.
We've elected to switch gears a bit and show correlation between the 10-year bond (ZN) and the S&P futures contract. The S&P contract is the Standard and Poor's, and the purpose is to show reverse correlation between the two instruments. Remember it's likened to a seesaw, when up goes up the other should go down and vice versa.
On Friday the ZN made its move at around 8:30 AM EST. The ZN hit a Low around that time and the S&P moved Lower. If you look at the charts below ZN gave a signal at around 8:30 AM EST and the S&P moved Lower at around the same time. Look at the charts below and you'll see a pattern for both assets. ZN hit a Low at around 8:30 AM EST and the S&P was moving Lower shortly thereafter. These charts represent the newest version of MultiCharts and I've changed the timeframe to a 15-minute chart to display better. This represented a Long opportunity on the 10-year note, as a trader you could have netted about 20 ticks per contract on this trade. Each tick is worth $15.625. Please note: the front month for the ZN is now Mar '22. The S&P contract is now Mar '22 as well. I've changed the format to Renko bars such that it may be more apparent and visible.
Charts courtesy of MultiCharts built on an AMP platform
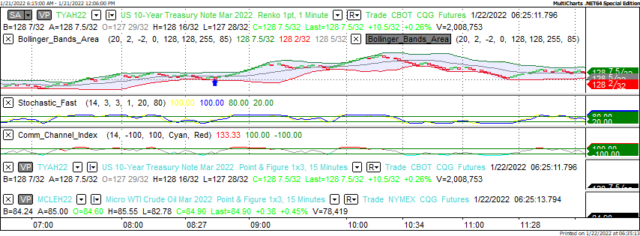
ZN - Mar 2022 - 01/21/22
-637786203135747538.png)
S&P - Mar 2022 - 01/21/22
Bias
On Friday we gave the markets a Neutral or Mixed bias as we didn't see any semblance of market correlation. The futures were all over the map with no order or normalcy at all. The Dow dropped 450 points and the other indices lost ground as well. Today we aren't dealing with a correlated market and our bias is to the Downside.
Could this change? Of Course. Remember anything can happen in a volatile market.
Commentary
Friday morning, we saw no sense of normalcy in the markets at all. The futures were mainly Lower with the exception of the Bonds but despite this the indices themselves were Mixed. This entire week we saw the markets drop each and every day. The Dow alone dropped more than 1600 points in 4 days' time. So what's happening? Geopolitics are taking control both domestically and globally. Domestically the Biden Administration can't seem to get anything passed in terms of voting rights or Build Back Better. Globally Russia is saber rattling and the last time they did this (2013) the global markets fell. The same situation is happening now as Russia is threatening to invade the Ukraine even though they say they aren't. The US also has to be concerned with China possibly invading Taiwan. Taiwan is a major exporter of computer chips that are used in automobiles. Wonder why the price of vehicles is going up? Don't wonder too long. The good news is Intel is expanding capacity for chip manufacturing is this "too late, too little"? Only time will tell.
Author

Nick Mastrandrea
Market Tea Leaves
Nick Mastrandrea over 20 years experience in trading and formerly held a NASD Series 7. He currently holds a NJ Life, Health and Variable Authority. Nick is a published writer and his work has appeared in Futures Magazine, TraderPlanet and others.


