Geopolitical Tension Could Be Catalyst for Gold’s Rally
- Rising Geopolitical Tension between U.S. and Russia

The geopolitical tension between the United States and Russia escalated rapidly in the past two weeks. Two weeks ago, the U.S. Treasury Department announced fresh sanctions against Russian oligarchs and companies due to “Russia’s malign activity around the globe”. This new sanctions have caused economic pain to Moscow with Russian Ruble and MOEX benchmark index plunging.
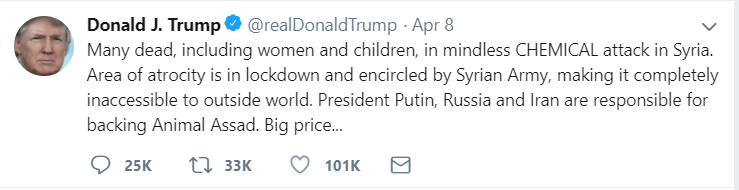
The tension between the two countries escalated further after the use of nerve agent to poison a Russian ex-spy and his daughter in England in March, which is blamed on Russia. This then follows the alleged chemical weapons attack at the town of Douma in Syria on April 4 by the Assad’s regime. More than 80 civilians were reported dead and hundreds suffered symptoms consisted with reaction to a nerve agent chlorine and sarin. President Trump condemned the attack to Assad, Russia, and Iran in his personal tweet and threatened a big price to pay
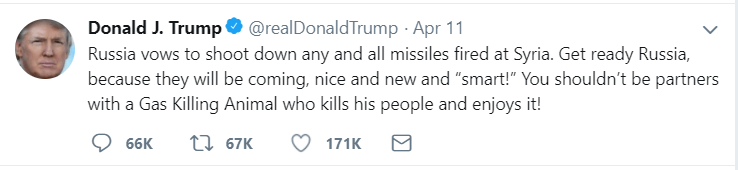
The verbal exchange continued as Russia responded by saying they could shoot down missiles from the United States if they attack Syria. President Trump in turn followed up in his tweeter:
Late last week President Trump seemed to dial back from his threat of imminent strike, perhaps as criticisms come that he should not tip this kind of decision in social media as it will eliminate any element of surprise. Or perhaps President Trump wants to wait for the weekend to carry the strike to reduce the impact on the market and allows market participants to digest the development without over-reaction.
War Breakout in Syria
Over the weekend however, President Trump followed up on his threat. The coalition forces of the United States, U.K, and France launched a precision military strike in Syria. The strike was limited in scope and target three Syrian chemical weapons facilities. The U.S. was particularly focused on targets which do not involve Russian forces in Syria and reduce the risk of civilian casualties.
The military action was designed to be limited in scope to deter the use of chemical weapons. The U.S and its allies do not want to get involved in the civil war which has raged for years in Syria involving militias, terrorist groups, and other world powers. It remains to be seen if the goal could be achieved and it will be interesting to see the global market’s reaction when it opens next week.
Gold’s Technical View
Gold traditionally is seen as a a safe haven instrument in times of uncertainty and turmoil. Technically, the long term technical picture appears bullish and the current geopolitical turmoil could be the catalyst needed for the next leg up
Gold vs Yen (XAUJPY) Technical Chart
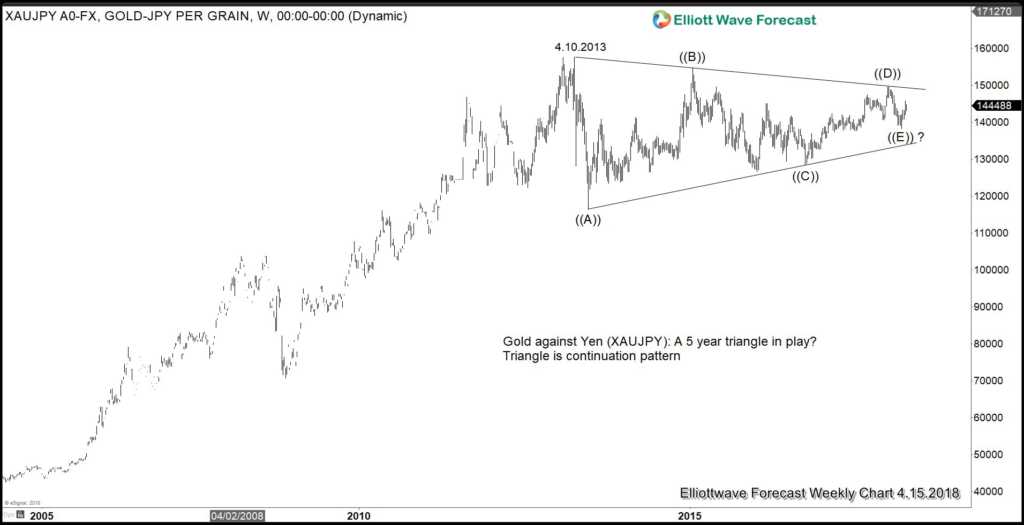
Weekly chart of XAUJPY above shows that the instrument has been trading in sideways triangle Elliott Wave structure for 5 years since year 2013. Triangle is typically a continuation structure. and as the previous trend before 2013 is higher, it’s likely to resume higher again once the sideways consolidation is complete
Gold vs USD (XAUUSD) Technical Chart
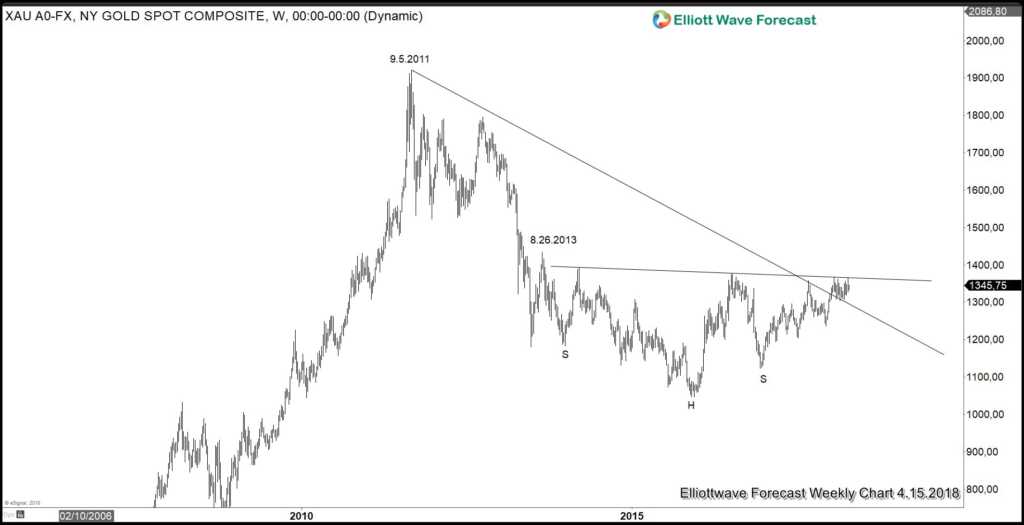
Weekly chart of XAUUSD above shows that the metal has ended cycle from 2011 peak, as seen in the break above the trend line. In addition, it has formed a 5 year base, an inverse head and shoulder like pattern. In the near term, it has not been able to break the neckline, but a break above 1/25/2018 peak ($1366) should give signal the next leg higher has started.
Gold 5 swing bullish sequence from 2016 low
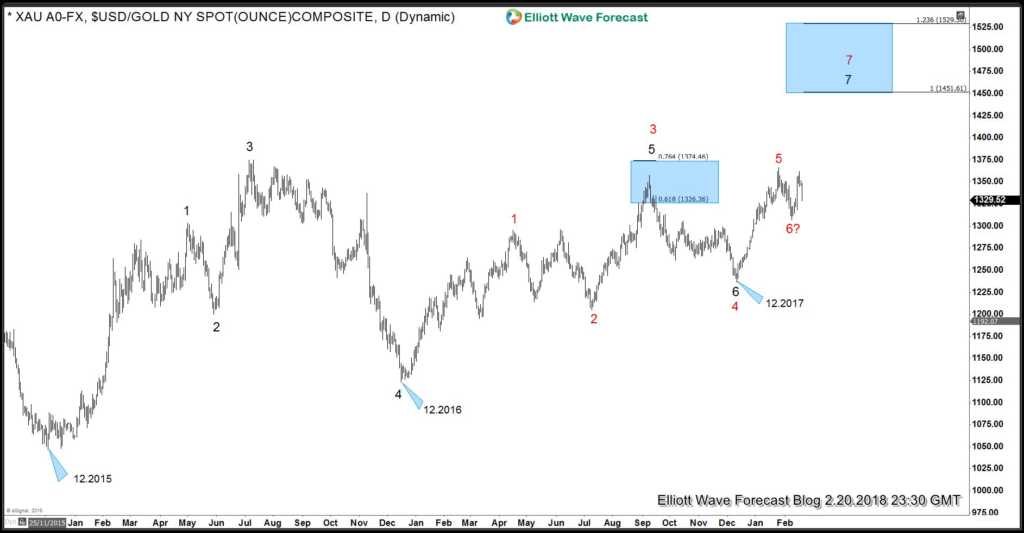
In addition to the weekly chart which shows a 5 year basing pattern, XAUUSD daily sequence chart above also shows a 5 swing sequence from 2016 low, favoring further upside towards $1451 – $1529 area to complete 7 swing double three Elliott Wave Structure (WXY), provided that pullbacks stay above 12.2017 low ($1236.66). Please note that the number on the chart represents on the swing count, not an Elliott Wave count.
Become a Successful Trader and Master Elliott Wave like a Pro. Start your Free 14 Day Trial at - Elliott Wave Forecast.
Author

Elliott Wave Forecast Team
ElliottWave-Forecast.com


