|

GDX found sellers as expected from blue box area

In this technical blog, we will look at the past performance of the 1-hour Elliott Wave Charts of the Gold miners ETF ticker symbol: GDX. In which, the decline from the 24 October 2024 high is unfolding in a corrective sequence. Also showed a lower low sequence with a bearish sequence stamp. Therefore, we knew that the structure in GDX is incomplete to the downside & should see more weakness. So, we advised members to sell the bounces in 3, 7, or 11 swings at the blue box areas. We will explain the structure & forecast below:

GDX one-hour Elliott Wave chart from 1.10.2025

Chart

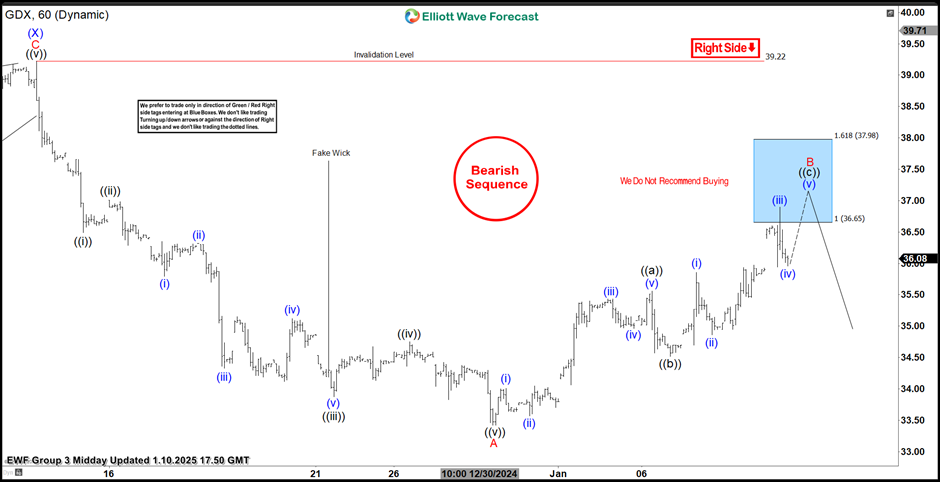
Here’s the 1-hour Elliott wave Chart from the 1.10.2025 Midday update.  In which, the decline to $33.42 low ended wave A of (Y) & made a bounce in wave B of (Y). The internals of that bounce unfolded as an Elliott wave zigzag correction. And managed to reach the blue box area towards $36.65- $37.98 blue box area. From there, sellers were expected to appear looking for more downside or for a 3 wave reaction lower at least.

GDX latest one-hour Elliott Wave chart from 1.14.2025

Chart

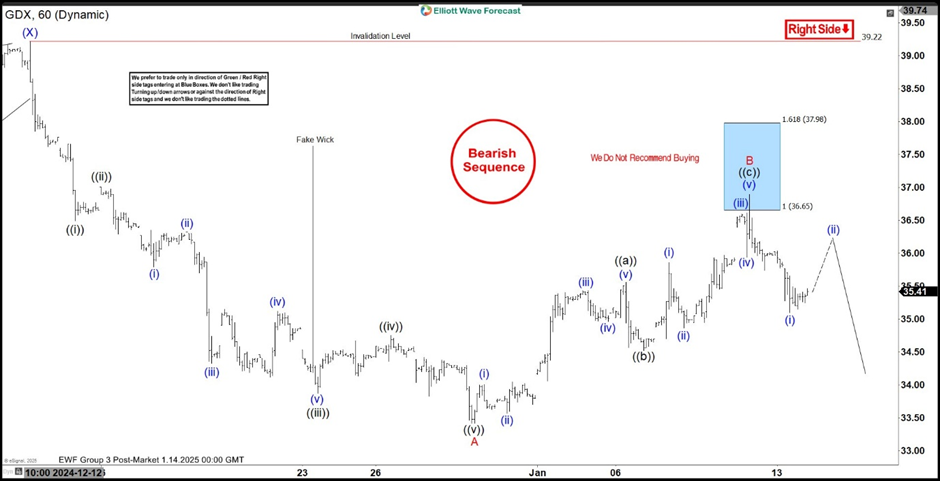
This is the Latest 1-hour view from the 1.14.2025 Post-Market update. In which the ETF is showing a reaction lower taking place from the blue box area allowing shorts to get into a risk-free position shortly after taking the position. However, a break below the $33.42 low would still be needed to confirm the next extension lower & avoid a double correction higher. Now, as far as bounces fail below $36.90 high GDX is expected to resume the downside. Ideally towards $29.39- $27.07 target area lower minimum before a bounce happens.

Author

Elliott Wave Forecast Team

Elliott Wave Forecast Team

ElliottWave-Forecast.com

More from Elliott Wave Forecast Team
Share:

Editor's Picks

AUD/USD falls to near 0.7100 after slipping below 50-day EMA

AUD/USD depreciates after registering minor gains in the previous day, trading around 0.7120 during the Asian hours. The technical analysis of the daily chart shows the pair consolidating sideways within a rectangle pattern, as neither bulls nor bears gain control. The AUD/USD pair is holding a slight bearish tone however as it sits beneath both the nine-day and 50-day EMAs.

160.00: USD/JPY back near intervention territory after upbeat US jobs report

US Nonfarm Payrolls beat expectations by a wide margin in May, with 172K jobs added. The US Dollar rebounds after the release, helping USD/JPY recover from its intraday lows. Warnings from Japanese authorities continue to limit upside potential near the 160.00 threshold.

Gold targets $4,300 amid stronger Dollar

Gold faces increasing selling interest and navigates the area of three-month lows near the $4,300 mark per troy ounce on Friday. The precious metal’s decline comes as traders assess the stronger-than-expected NFP, while the bid bias in the Greenback and higher US Treasury yields also collaborate with the retracement.

Cardano hits five-year low even as Hoskinson clarifies "break" isn't an exit

Cardano (ADA) price is down 10% at press time on Friday, extending losses over 30% so far this week amid Charles Hoskinson's clarification that "break" isn't an exit.

Week ahead – Fed countdown begins amid US inflation data and geopolitical risks

Fed Chair Warsh’s first meeting approaches as key US inflation data could reshape expectations. Oil prices remain elevated as US-Iran talks continue; tariffs also return to the spotlight. ECB is expected to hike; will it be a one-off move or is July live?

The US economy defies the rules: 100 days into the Oil shock and the recession signal is still missing

More than three months after the start of the Iran war and the resulting disruption to global energy markets, the US economy continues to display remarkable resilience. The conflict has triggered a sharp rise in Oil prices, reignited inflationary pressures and fueled widespread concerns about a potential economic slowdown.