|

GDX Elliott Wave View: Found Buyers in Blue Box and Rallied

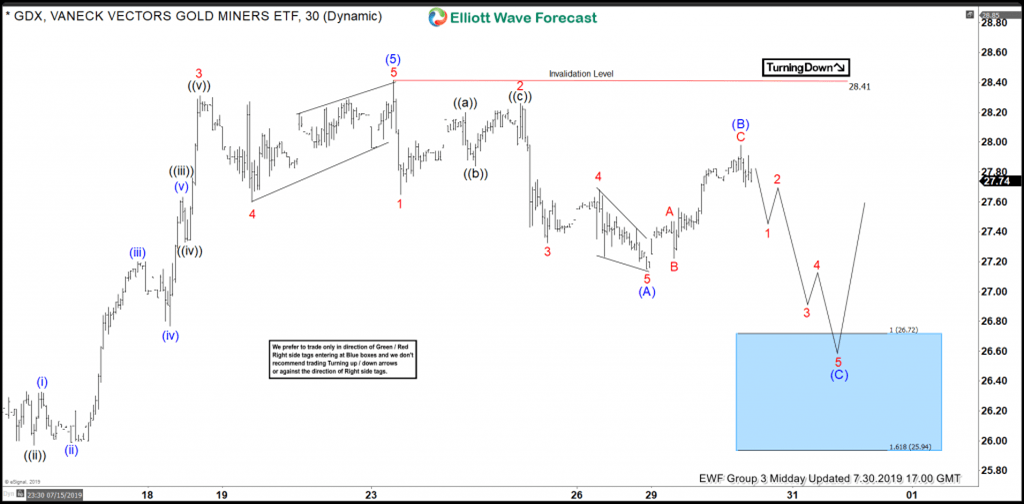
Hello fellow traders. Today, I want to share some Elliott Wave charts of the GDX which we presented to our members in the past. You see the 1-hour updated chart presented to our clients on the 07/30/19. showing that GDX ended the cycle from 05/13/19 low at the peak of 07/23/19 at 28.41.

Below from there, we advised members that the pullback should extend lower into the blue box. Below 28.41 level, we said to our clients it should see the equal legs from 07/23 peak towards the areas of the 100 – 1.618 Fibonacci extension of the blue wave (A)-(B) which came around 26.72-25.94. Therefore, we expected buyers to appear in the sequences of 3, 7 or 11 swings. And that was the first area for buyers to appear to take prices to new highs.

GDX 07.30.2019 1 Hour Chart Elliott Wave Analysis
gdx

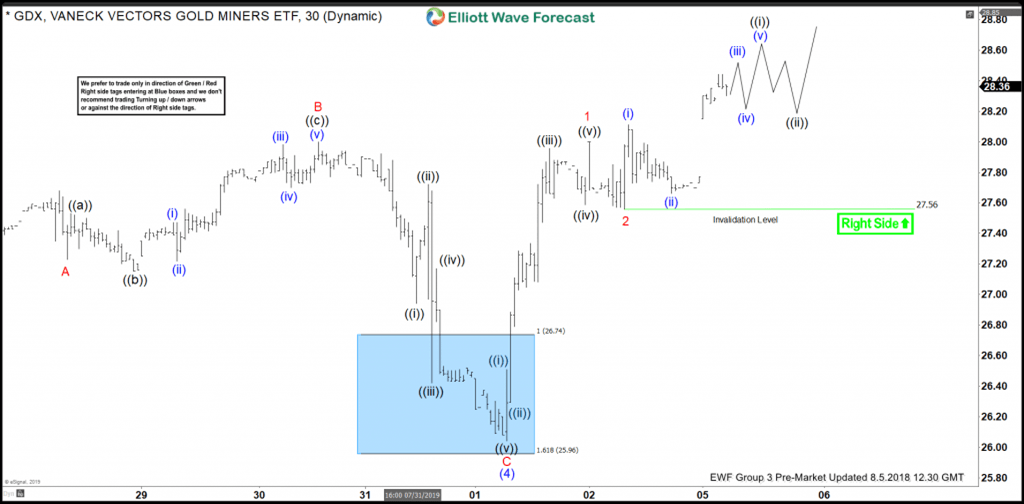
In the last Elliott Wave chart, you can see that GDX reacted nicely higher and continued the rally. Later on it made even a new high. Due to the right side up tag, we expected GDX to be supported overall.  Any trades from that area have been risk-free, which means the stop-loss was moved to breakeven, targeting higher levels.  Do please keep in mind that the 1-hour chart which I presented might have changed already. The blue boxes you see in our charts are our so-called High-Frequency boxes. Where the market ideally shows us a reaction either lower or higher. These areas are used be traded in the direction of the right side.
If you are interested in how to trade our blue box areas and want to understand how Elliott Wave works. Then I recommend you to get a shot on our 14 days free trial below. We present a lot of trading setups in our 3 Live Trading Rooms.
 

GDX 07.30.2019 1 Hour Chart Elliott Wave Analysis
gdx

Author

Elliott Wave Forecast Team

Elliott Wave Forecast Team

ElliottWave-Forecast.com

More from Elliott Wave Forecast Team
Share:

Editor's Picks

EUR/USD nears 1.1600 after a volatile day

EUR/USD trades near the 1.1600 mark, boosted late in the American session by news coming from the White House. US President Donald Trump announced a deal with Iran to be signed "soon" by the Middle Eastern country, hinting at probably the weekend. Trump also canceled the planned attacks for Friday.

GBP/USD recovers above 1.3400 on USD selloff

GBP/USD is back firm above 1.3400 with the Greenback giving up most of its weekly gains, following headlines coming from the United States signaling US President Donald Trump signed a proclamation in which he announced that a deal with Iran is pretty much sealed.

Gold jumps above $4,200 on war-relief headlines

Gold surged to fresh intraday highs above $4,200 late in the American afternoon, after US President Donald Trump announced he canceled strikes over Iran, adding an agreement is in its "final stages."

Crypto Today: Bitcoin, Ethereum, XRP rebound broadens despite continued US-Iran strikes

Bitcoin steadies its recovery on Thursday, edging higher toward $63,000 despite incessant capital outflows. Meanwhile, altcoins, including Ethereum and Ripple, exhibit subtle rebound signs, trading above $1,650 and $1.12, respectively.

AI Crypto Forecast: Bittensor, Near Protocol, Internet Computer rebound gains traction 
Cryptocurrency prices are broadly rising on Thursday, following an overstretched downtrend. Despite sticky geopolitical tensions in the Middle East, tokens at the intersection of the blockchain technology and Artificial Intelligence (AI), including Bittensor (TAO), Near Protocol (NEAR) and Internet Computer (ICP) are testing recovery potential.
4.2% headline, 0.2% core: Why the Fed's next hike may be targeting the wrong problem

May's CPI put headline inflation at 4.2% on the year, up from 3.8% in April and the hottest reading since April 2023, while core prices rose just 0.2% on the month, undershooting the 0.3% consensus and halving April's pace.