GDP moves dow, slightly

USD: Dec '23 is Up at 103.140.
Energies: Jan '24 Crude is Up at 78.38.
Financials: The Mar '24 30 Year T-Bond is Down 17 ticks and trading at 117.03.
Indices: The Dec '23 S&P 500 emini ES contract is 52 ticks Higher and trading at 4572.25
Gold: The Dec'23 Gold contract is trading Down at 2058.60.
Initial conclusion
This is not a correlated market. The USD is Up and Crude is Up which is not normal, but the 30 Year T-Bond is trading Lower. The Financials should always correlate with the US dollar such that if the dollar is Higher, then the bonds should follow and vice-versa. The S&P is Higher and Crude is trading Higher which is not correlated. Gold is trading Lower which is correlated with the US dollar trading Up. I tend to believe that Gold has an inverse relationship with the US Dollar as when the US Dollar is down, Gold tends to rise in value and vice-versa. Think of it as a seesaw, when one is up the other should be down. I point this out to you to make you aware that when we don't have a correlated market, it means something is wrong. As traders you need to be aware of this and proceed with your eyes wide open. Asia is trading mainly Higher with the exception of the Singapore exchange which is Lower. All of Europe is trading Higher.
Possible challenges to traders
-
Core PCE Price Index m/m is out at 8:30 AM EST. This is Major.
-
Unemployment Claims is out at 8:30 AM EST. This is Major.
-
Personal Income m/m is out at 8:30 AM EST. This is Major.
-
Personal Spending m/m is out at 8:30 AM EST. This is Major.
-
FOMC Member Williams Speaks at 9:15 AM EST. This is Major.
-
Chicago PMI is out at 9:45 AM EST. This is Major.
-
Pending Home Sales m/m is out at 10 AM EST. This is Major.
-
Natural Gas Storage is out at 10:30 AM EST. This is Major.
Treasuries
Traders, please note that we've changed the Bond instrument from the 30 year (ZB) to the 10 year (ZN). They work exactly the same.
We've elected to switch gears a bit and show correlation between the 10-year bond (ZN) and the S&P futures contract. The S&P contract is the Standard and Poor's, and the purpose is to show reverse correlation between the two instruments. Remember it's likened to a seesaw, when up goes up the other should go down and vice versa. Today we aren't dealing with a correlated market and our bias is to the Upside.
Yesterday the ZN migrated Higher at around 8:30 AM EST as the S&P hit a High at around the same time. If you look at the charts below the S&P gave a signal at around 8:30 AM and the ZN started its Upward trend. Look at the charts below and you'll see a pattern for both assets. S&P hit a High at around 8:30 AM and migrated Lower. These charts represent the newest version of MultiCharts and I've changed the timeframe to a 15-minute chart to display better. This represented a Long opportunity on the 10-year note, as a trader you could have netted about a dozen ticks per contract on this trade. Each tick is worth $15.625. Please note: the front month for the ZN is now Dec '23. The S&P contract is now Dec' 23. I've changed the format to filled Candlesticks (not hollow) such that it may be more apparent and visible.
Charts courtesy of MultiCharts built on an AMP platform
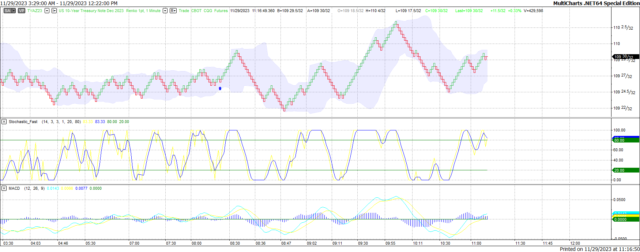
ZN - Dec 2023 - 11/29/23
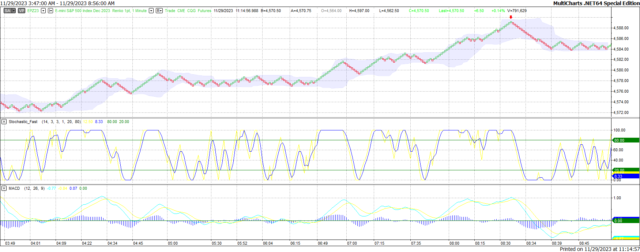
S&P - Dec 2023 - 11/29/23
Bias
Yesterday we gave the markets an Upside bias as Gold and the indices were correlated. The markets traded Mixed as the Dow closed Higher by 13 points at the close of the session but the indices did not follow that path as they traded Lower. Today we aren't dealing with a correlated market and our bias is to the Upside.
Could this change? Of Course. Remember anything can happen in a volatile market.
Commentary
Yesterday we put much stock in trade with the GDP being able to propel the markets Higher. That only worked with the Dow as the other indices closed Lower. The GDP showed the US economy Higher by 5.2% which was above expectation, but another thought crossed our minds. If the GDP showed a gain, then it also means the Fed may be reluctant to lower rates anytime soon. As it stands right now, we don't know what the Fed will do. Half the people say they'll Lower, and the other half says they may raise. As in all things only time will tell what they'll do.
Author

Nick Mastrandrea
Market Tea Leaves


