GDP in the United States, what to expect?

The final US GDP data for the 4th quarter of last year will be released on Thursday, March 30-th Economists expect GDP to grow by 2.7% (the previous preliminary figure will not be revised).
Meanwhile, 2.7% is already an adjusted value. The data published in January 2023 were better than expected (+2.9%), but the figure was revised downwards.
Considering that the GDP release is traditionally strong for both the US currency and the US stock indices, the release of the final figure can be treated as important news. We will analyze if economists are correct in their estimates.
However, before that, let's understand the GDP forecast for the current year.
GDP forecast for 2023
It is no secret by now that the inflation surge in the US in 2022 was more of a non-monetary nature. The rise in oil prices due to the conflict between Russia and Ukraine led to an increase in supply chains and, in turn, to a surge in inflation rates. This can be traced in the Consumer Price Index (CPI) chart versus the Producer Price Index (PPI) chart.
Picture 1. CPI VS PPI Indices
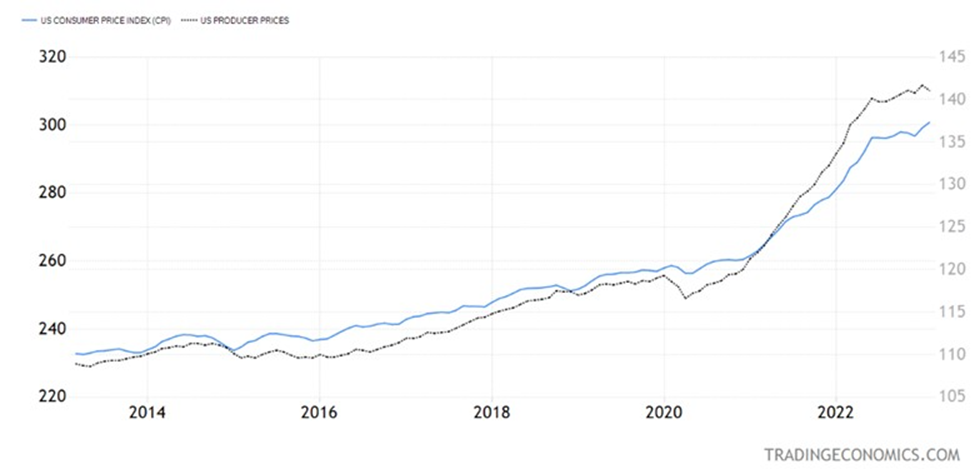
We can notice that closer to 2022 (lockdowns canceled and oil prices recovering), the dynamics of PPI growth began to significantly outpace the dynamics of consumer price growth, which is quite a landmark event in American economic history.
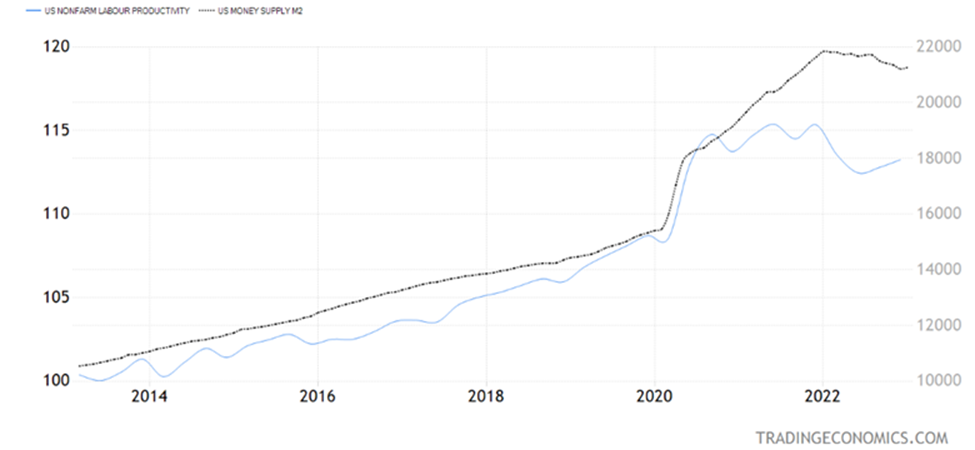
Meanwhile, the liquidity accumulated during 2020 by pumping "cheap" cash into the markets led to two significant consequences:
First, it forced the Fed to move to monetary tightening through rate hikes and the launch of QT.
Second, it hurt labor productivity, leading to the emergence of many so-called zombie companies.
Picture 2. Nonfarm Productivity VS US Money Supply M2
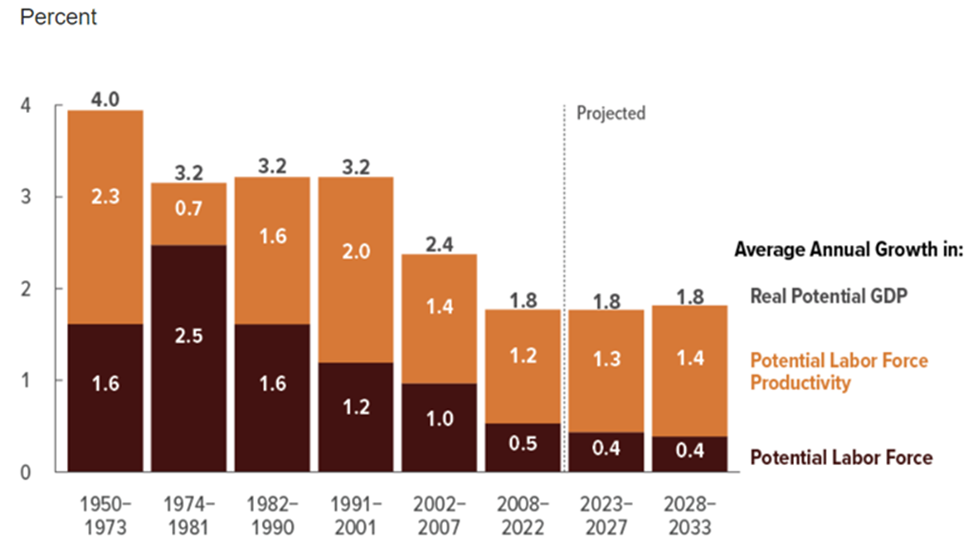
In February of this year, the Congressional Budget Office (CBO) released its Economic Outlook for 2023 to 2033, which noted the following:
'The economy's potential output is projected to grow much more slowly, on average, over the 2028 - 2033 period than it did in the second half of the 20th century, mainly because of an ongoing, long-term slowdown in the growth of the labor force as well as slower growth of productivity.
In the CBO survey, the problem was mainly at the level of the potential labor force, but the focus was on productivity growth; it is easy to see that productivity growth is still well below the levels of the 1950s and 2000s.
Picture 3. Growth of Real Potential GDP and Its Components. Source: Congressional Budget Office
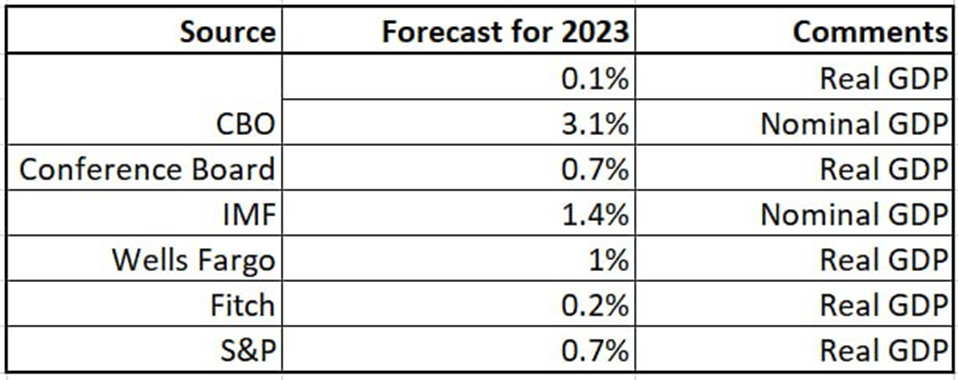
Consequently, CBO sees the prospect of real GDP growth slowing to 0.1% in 2023.
The rest of the news agencies also believe that GDP growth this year will be modest, although not all are as pessimistic as the CBO:
Picture 4. GDP forecasts
Consequently, the expectation of a GDP slowdown in Q4 last 2022 looks quite logical and reasonable.
Let's analyze the indicators that may affect the release from March 30th.
Consumption
For December, there were positive revisions to U.S. new home sales (625K VS the previously published 616K) and Existing home sales (4.03M VS 4.02M as the previous fact). This is a minor change that is unlikely to have a significant impact on the figure.
Retail and Core Retail Sales for December fell 1.1% and 0.9%, respectively. The Retail sales index was not revised subsequently, but the Core Retail Sales were revised positively.
Revised Personal Consumption Expenditure for Q4 grew by 4.3%. The final figure is also expected to be 4.3%, so the PCE is already included in the preliminary GDP, and it is hard to make any predictions here.
Trade balance
The trade deficit for December last year was revised upward. On March 8th, the index was revised to -67.20B.
Picture 5. Trade balance deficit
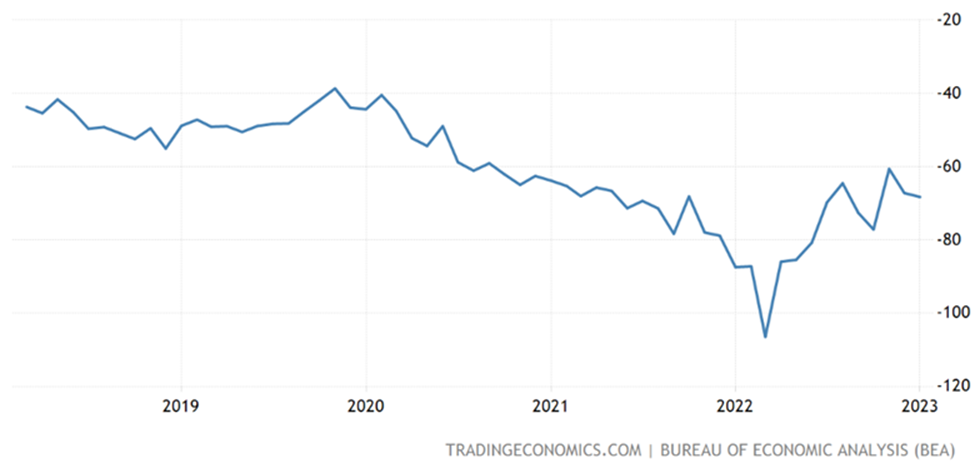
This is a positive factor for the expected GDP.
If so, EURUSD and GBPUSD may fall, while USDJPY and USDCHF may start rising. The FBS platform allows open positions in both directions. This helps traders to maximize their profit and to get great results from any price movements.
We don’t expect the price movement to last long in case of the US dollar devaluation. The market remembers that the Fed may reverse the monetary policy, so the dollar is so weak right now.
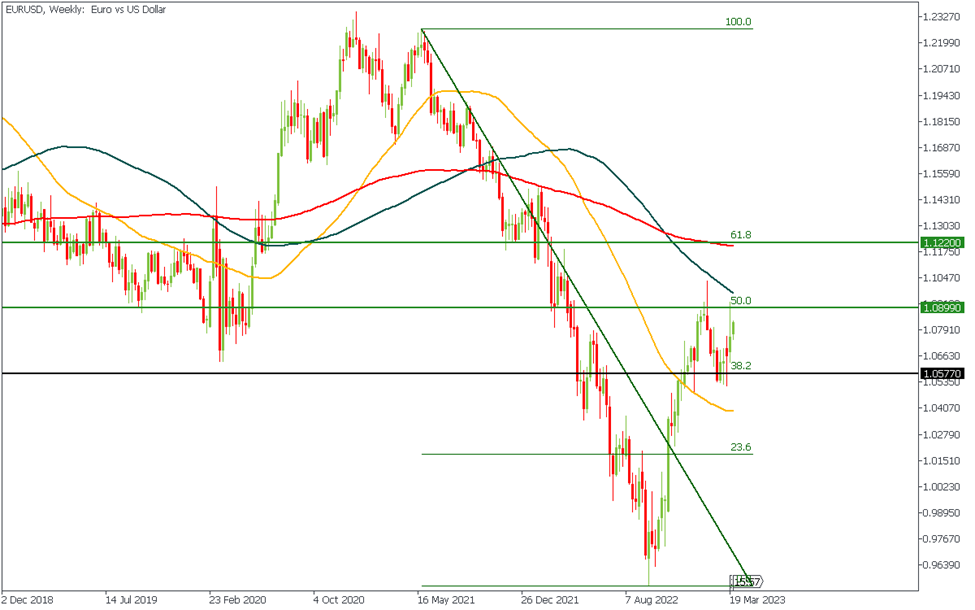
According to technical analysis, EURUSD is between two Fibo correction levels, 38.2% (1.05770) and 50% (1.08990). If we are mistaken and the pair breaks the resistance line, the next resistance is 1.12200.
Government expenditures and investments
Government expenditures and investments in Q4 also began to grow. At the same time, characteristically, for 2022, investments decreased to 37% of GDP compared to 2021 (public expenditures were over 43%).
Conclusion
There is a high probability that the final GDP figure will be at the expected +2.7% or even slightly higher.
USD reaction is expected to be positive.
Taking into account the fact that the market has already priced in the key rate reduction by the end of the current year, the market may consider the publication of the indicator higher than expected as a signal for the Fed to take a longer pause in monetary easing, which means the stock markets may react even negatively to the good indicator.
If the fact turns out to be worse than forecast, it may further convince the market to cut the rate, and the dollar may fall, while stock indices may even rise.
Author

FBS Team
FBS
FBS team is a group of professional analysts focused on Forex, stock, and commodity markets. Each expert possesses a years-long experience in fundamental and technical analysis.