The inflation illusion: How government formulas shape the data [Video]
![The inflation illusion: How government formulas shape the data [Video]](https://editorial.fxsstatic.com/images/i/inflation-02.jpg)
Every month, the government releases a barrage of economic statistics. Employment, inflation, consumer spending, economic growth, and countless other measurements are presented as objective facts that policymakers, investors, and the public can use to understand the economy.
But what happens when the methodology used to produce those numbers changes?
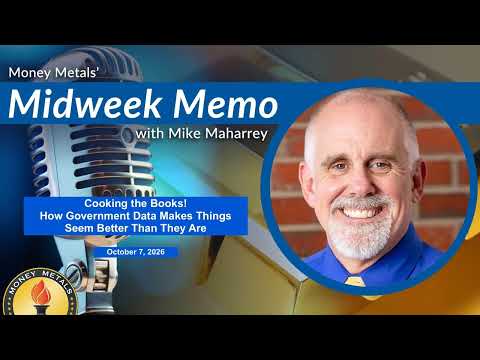
In this episode of the Midweek Memo, Mike Maharrey examines how government agencies calculate and revise economic data, arguing that seemingly small methodological decisions can have a significant effect on the picture those statistics present.
His focus is particularly sharp on inflation data — including the Consumer Price Index (CPI) and the Federal Reserve's preferred Personal Consumption Expenditures (PCE) price index — and the implications for anyone trying to determine how quickly purchasing power is actually eroding.
When data starts shaping reality
Maharrey opens the episode with an example of how easily people can be persuaded to accept something as reality simply because it looks convincing.
He recounts a viral story about a zookeeper supposedly rescued by a tiger after collapsing near its enclosure. The accompanying photographs appeared authentic, but the entire story — including the images — had been generated by artificial intelligence.
The lesson extends beyond AI-generated photographs.
If an image that never happened can become accepted as fact because it looks real, Maharrey argues, statistics can have a similar effect. Numbers carry an additional aura of authority because they are presented as objective measurements.
But economic data isn't simply observed. Much of it is constructed through surveys, estimates, assumptions, formulas, seasonal adjustments, and subsequent revisions.
That means the methodology matters.
Employment numbers don't always tell the same story
Maharrey points to Bureau of Labor Statistics employment data as one example.
Initial employment reports are frequently revised as more information becomes available. Revisions themselves aren't necessarily evidence of a problem — collecting nationwide employment data is complicated, and adjustments are expected.
The question, he argues, is why those revisions have historically tended to move disproportionately in one direction.
According to the figures discussed in the episode, between 2003 and 2024, final annual BLS employment numbers were lower than the initial reports 14 times, compared with seven upward revisions.
That raises a broader question: if major economic statistics can change substantially after their initial release, how much confidence should people place in the first number they see?
The inflation formula matters
The bigger issue in the episode is inflation.
Maharrey explains that the government changed the methodology used to calculate the CPI during the 1990s because officials believed the existing approach overstated inflation.
The result is that today's inflation statistics cannot simply be compared with historical numbers without considering how the underlying methodology has changed.
Maharrey argues that if the government were still using a methodology similar to the one employed during the 1970s, today's reported CPI inflation rate would be considerably higher than the official figure.
Whether one accepts that comparison or not, the larger point remains: inflation isn't measured with a ruler. It is calculated using a formula — and formulas involve assumptions.
Why the Fed prefers PCE
The episode then turns to the PCE price index, the inflation measure favored by the Federal Reserve.
PCE and CPI measure inflation somewhat differently, including differences in the way consumer spending patterns and changes in consumption are incorporated into the calculations.
Maharrey notes that PCE has historically tended to run below CPI over longer periods. He then examines a recent revision by the Bureau of Economic Analysis that changed the PCE methodology.
According to the episode, the adjustment lowered the reported measure of core PCE inflation by roughly 0.1 percentage point.
That may sound insignificant.
But when policymakers use these statistics to determine interest-rate policy, and when investors use them to assess the purchasing power of the dollar, even seemingly small changes can influence how the economy is perceived.
The problem with "Substitution"
One of the more important concepts discussed is the use of substitution within inflation calculations.
Consumers don't always continue buying the exact same products when prices change. If the price of one item rises significantly, consumers may switch to another product.
Statistical formulas attempt to account for those changes in purchasing behavior.
But doing so introduces assumptions about how consumers respond to changing prices.
Maharrey argues that these adjustments can make measured inflation appear less severe than the increase in the cost of maintaining a comparable standard of living might suggest.
This is particularly important because official inflation statistics aren't merely academic measurements. They influence monetary policy, government programs, financial markets, and public perceptions of the economy.
Inflation can be hidden by the measurement
Maharrey's broader argument is that monetary inflation and price inflation aren't necessarily the same thing.
The government can expand the money supply and increase borrowing and spending, but the resulting price increases can become politically difficult when consumers feel their purchasing power deteriorating.
If inflation appears lower in the official statistics, however, the political and economic consequences may also appear less severe.
That creates an incentive — intentional or otherwise — for policymakers to focus on the most favorable interpretation of the numbers.
The result is a disconnect between what the statistics say and what people experience in their everyday lives.
A consumer doesn't experience "core PCE." They experience grocery bills, rent, insurance premiums, healthcare costs, gasoline, and other expenses.
And when those costs rise faster than official inflation suggests, people can understandably feel that the government statistics don't match reality.
Why Gold and Silver enter the conversation
This debate over inflation ultimately brings Maharrey back to precious metals.
If the purchasing power of fiat currency is gradually eroded, assets that exist outside the monetary system can become increasingly attractive to people looking for a way to preserve wealth.
Gold and silver have historically served this role.
Maharrey argues that investors shouldn't simply accept an official inflation figure without understanding how it was produced. Instead, they should recognize that changes in methodology can alter the way inflation is presented without changing the underlying prices consumers face.
The issue isn't necessarily that every government statistic is fabricated.
Rather, the methodology behind the statistic determines what the number actually tells you.
And when the methodology changes, the historical comparison can become much more complicated.
A "Nickel's worth" of advice about Gold scams
The episode closes on a very different — but practical — topic: precious-metals scams.
Maharrey highlights a recent Illinois case involving a bizarre gold scam in which victims were instructed to hand over gold in a Walmart parking lot after being approached by strangers using the phrase "black bug."
The unusual details may make the story memorable, but the underlying lesson is straightforward: don't hand your gold or money to an unknown person simply because they make a convincing pitch.
As precious metals attract greater attention, scams targeting buyers and owners can become an increasingly important concern.
Maharrey encourages listeners to work with established, reputable dealers and to exercise caution whenever someone approaches them with an unusual offer involving gold or silver.
Looking beyond the headline number
The larger message of this week's Midweek Memo is that economic statistics deserve scrutiny.
Inflation numbers, employment reports, and other government data can provide valuable information, but they aren't immutable facts handed down from above. They are estimates produced through methodologies that can change over time.
Understanding those methodologies makes it easier to recognize why official statistics sometimes don't seem to correspond with what people experience in their daily lives.
And for anyone concerned about the long-term purchasing power of the dollar, that distinction matters.
If inflation is more persistent than the headline numbers suggest, then protecting purchasing power becomes a different proposition entirely — and it helps explain why investors continue to look toward assets such as gold and silver as potential stores of value.
To receive free commentary and analysis on the gold and silver markets, click here to be added to the Money Metals news service.
Author

Joshua D. Glawson
Money Metals Exchange
Joshua D. Glawson is a writer on such topics as philosophy, politics, economics, finance, and personal development. He graduated with a Bachelor in Political Science from the University of California Irvine. His website is JoshuaDGlawson.com.