GBPUSD's MACD histogram might be signalling pullback

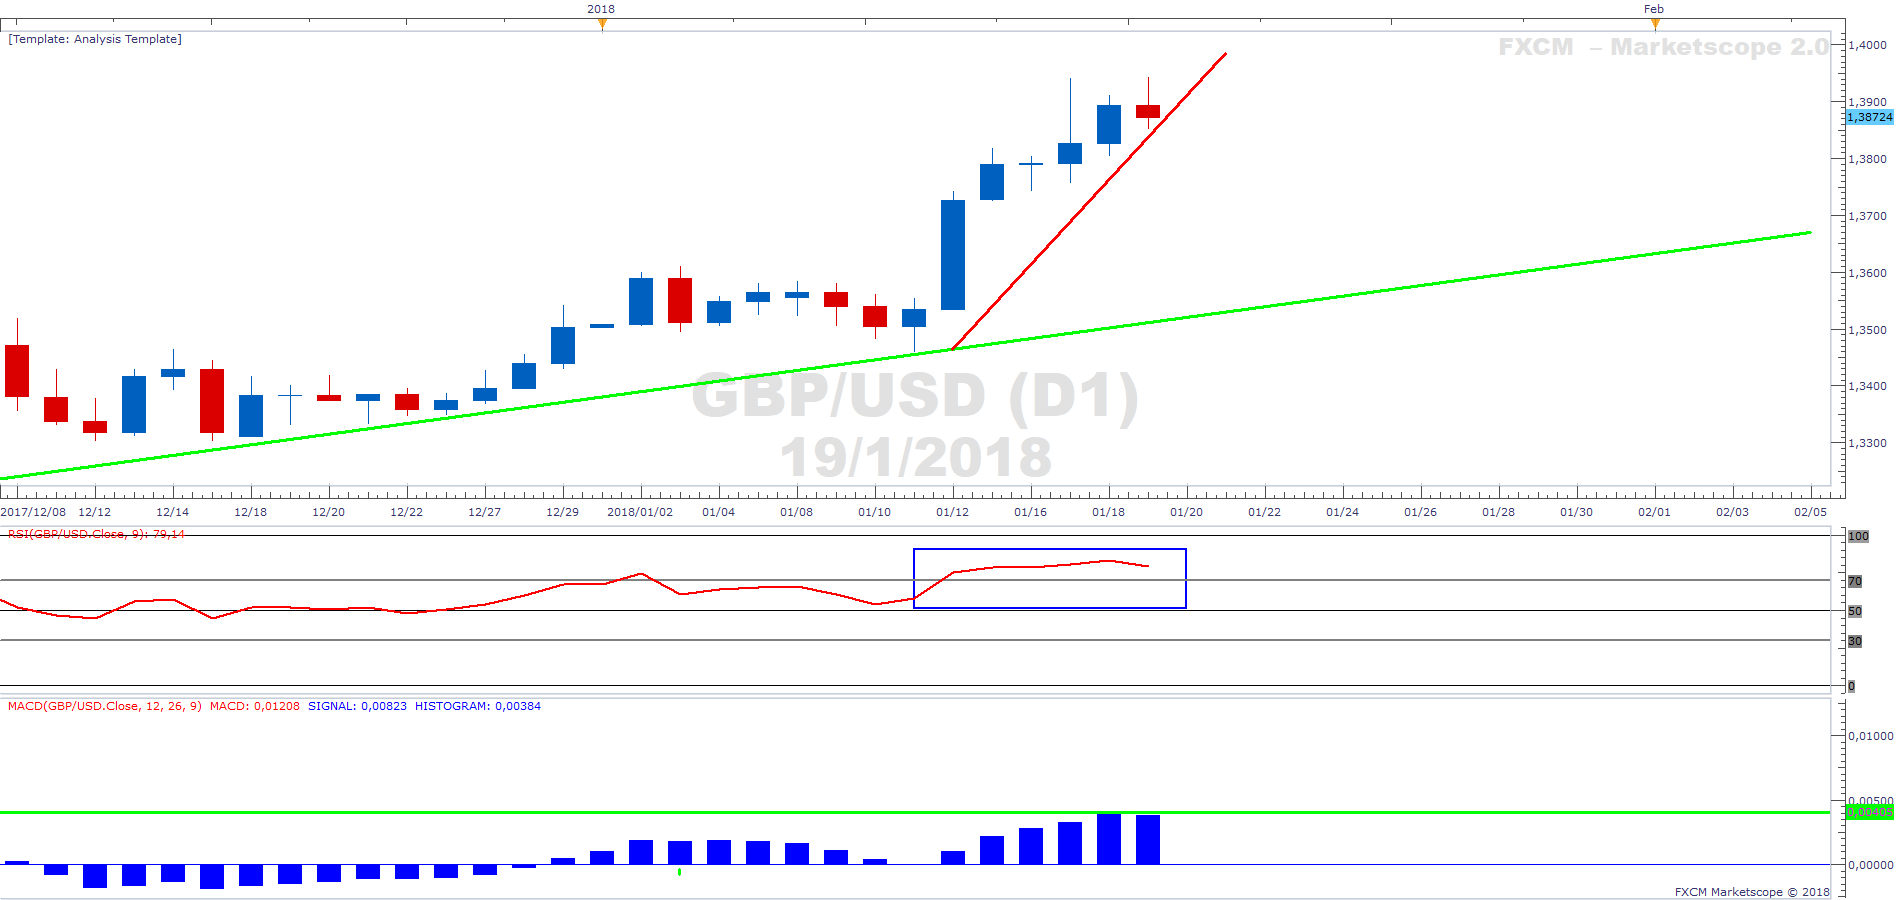
Daily
GBPUSD is overbought. It’s RSI(9) has moved from 82 to 78, which is still a relatively overbought reading. Moreover, price has risen in a parabolic fashion as can be seen by the shift from the green trendline (gentle gradient) to the red trendline (steep gradient). Today’s candle (still to complete) is a bearish inverse hammer. Bulls initially took price up to the high but then lost control to bears who have sold cable down to below its open for the day. Furthermore, the MACD histogram is ticking down. This may be the precursor to a pullback in the GBPUSD pair.
Author

Russell Shor (MSTA, CFTe, MFTA) has an Honours Degree in Economics from the University of South Africa and holds the coveted Certified Financial Technician and Master of Financial Technical Analysis qualifications from the Interna


