GBP/USD pulls back from 200-day SMA, maintains bearish pattern [Video]
![GBP/USD pulls back from 200-day SMA, maintains bearish pattern [Video]](https://editorial.fxstreet.com/images/Markets/Currencies/Majors/GBPUSD/brisiith-currency-14493013_XtraLarge.jpg)
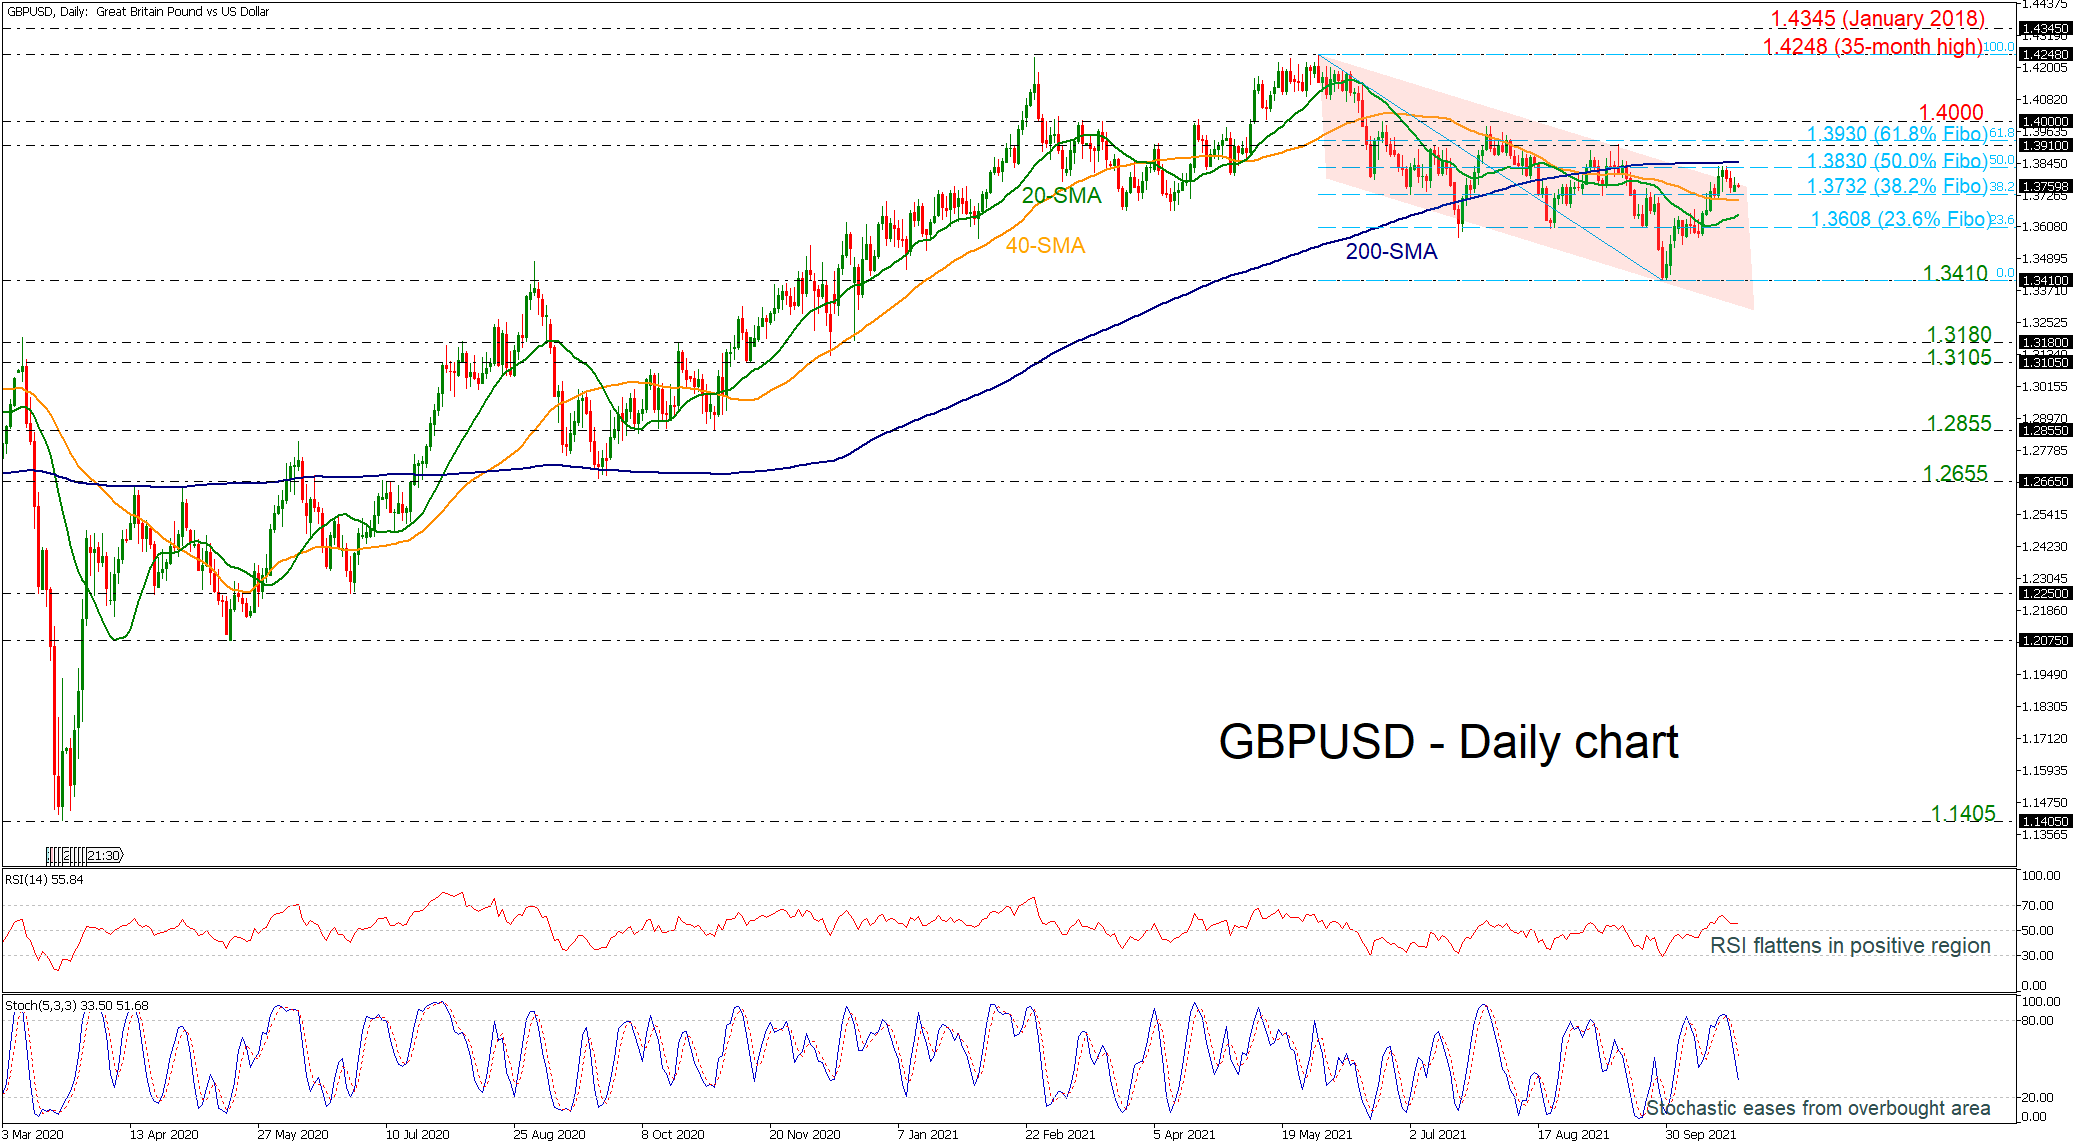
GBPUSD found a strong resistance at the 200-day simple moving average (SMA) currently at 1.3830, where the 50.0% Fibonacci retracement level of the down leg from 1.4248 to 1.3410 also happens to be. The price jumped slightly above the almost five-month-old descending channel but is retreating again in the very short term.
Technically, the RSI indicator is moving sideways in the positive region, suggesting a weakening positive bias. The stochastic oscillator is also sending discouraging signals as it is diving towards the 20 levels, confirming the recent downward move.
Failure to overcome the 200-day SMA could send the price down to the immediate support level of 1.3732, which is the 38.2% Fibonacci level, while not far below, the 40-day SMA may also be closely watched. Lower support could be next found near 1.3650, where the 20-day SMA is currently positioned, while a decisive close below this level could initially test the 23.6% Fibonacci of 1.3608 ahead of the 1.3410 number.
Alternatively, if 1.3830 proves easy to get through, the spotlight will turn to the 61.8% Fibonacci of 1.3930. On top of that, the bulls would need to clear the 1.4000 psychological level to push the rally towards the 35-month high of 1.4248.
In the medium-term picture, GBPUSD is maintaining a bearish outlook despite the insignificant violation of the downtrend channel. A drop below 1.3410 would endorse the negative outlook, though, a run above the 200-day SMA would shift the view back to neutral.
Author

Melina joined XM in December 2017 as an Investment Analyst in the Research department. She can clearly communicate market action, particularly technical and chart pattern setups.


