GBP/USD: Calling the Move Lower

Start of the trading week of August 4 – 9 / 2019 EWF members were already advised to watch for GBPUSD to make another move lower. The GBPUSD 1 Hour chart below, from our members area, clearly advises our members to watch for the termination of Wave ((iv)) in the blue box followed by a price reversal lower. Knowing which side to trade is key to be successful trader and by following our Elliott Wave count allows a trader to easily make a decision whether to enter a BUY or a SELL.
GBPUSD 1 Hour Weekend Chart 8.3.2019

Combining other trading strategies to match the Elliott Wave count will also add more confirmation and confidence in taking the trade.
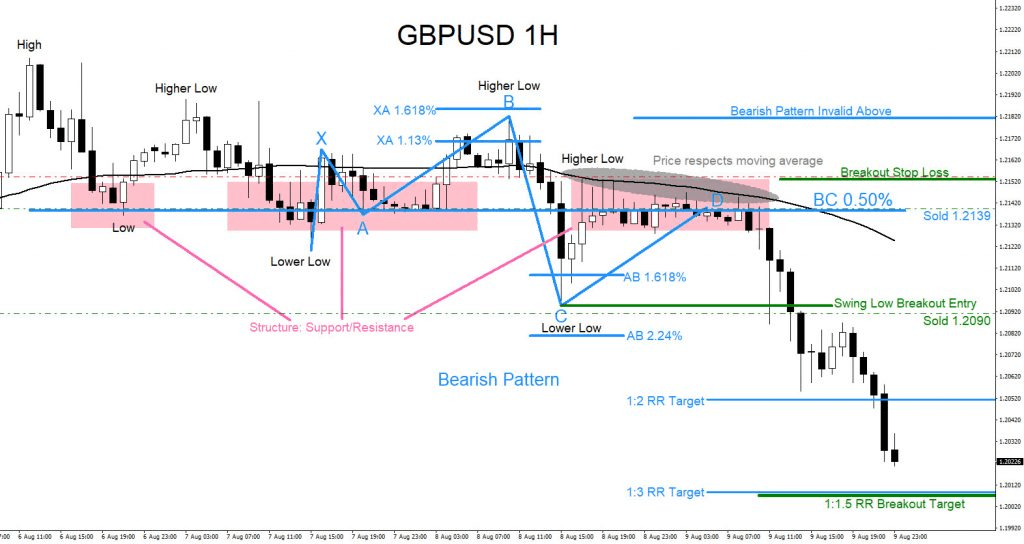
The GBPUSD 1 Hour chart below clearly shows a multiple of other trading strategies (market patterns) that were also calling for another extension lower and why I traded and SOLD the move lower. 1st SELL entry was at the point D (BC 0.50%) of the blue bearish pattern where there was also a support/resistance structure (pink). 2nd entry is on the momentum swing low breakout (green). Let’s see if we HIT 1:3 RR Target (1st entry) and 1:1.5 RR Target (2nd entry) this coming new trading week. A clear bearish scenario.
GBPUSD 1 Hour Chart 8.9.2019

Of course, like any strategy/technique, there will be times when the strategy/technique fails so proper money/risk management should always be used on every trade.
Author

Elliott Wave Forecast Team
ElliottWave-Forecast.com


