GBPUSD: A Potential Intraday Long

Whilst we await the longer four-hourly short swing trade described recently, intraday traders might choose to pass the time by stalking the current low on cable, which has been trading in a steady range on its hourly chart, as shown below.
Figure 1: GBPUSD Hourly Chart
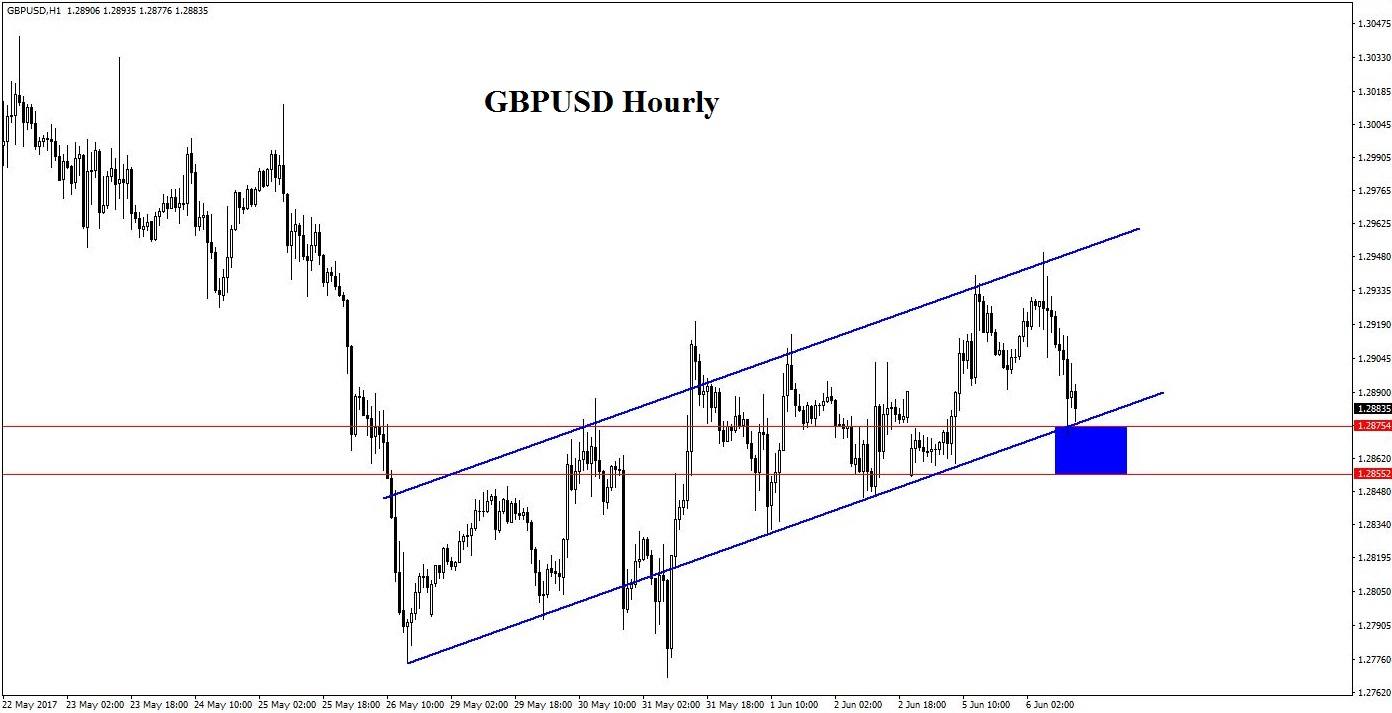
Price might overshoot the bottom of the channel briefly, but it is unlikely that it will break below the Blue Box of 1.2855-1.2875 without providing some sort of reaction. The 15-minute chart would be the appropriate timeframe to consider an entry on.
Figure 2: GBPUSD 15-Minute Chart
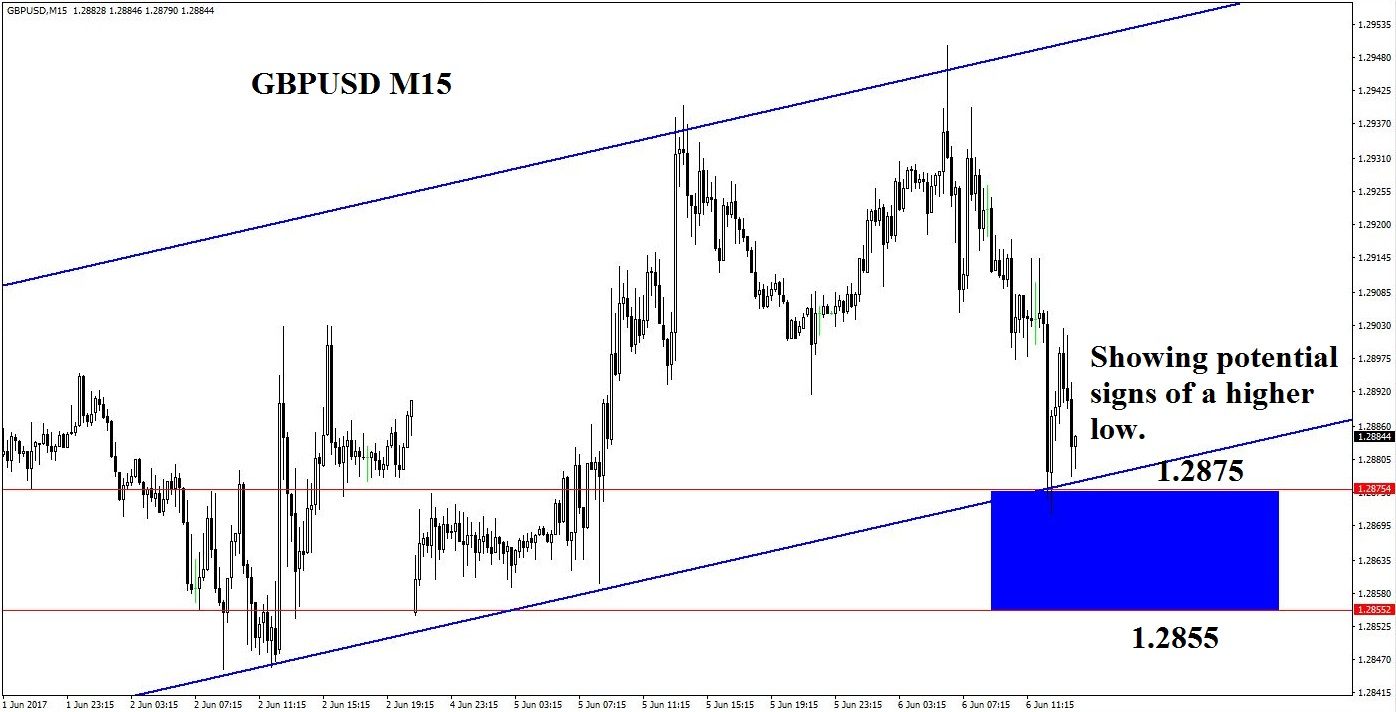
Already, on this timeframe, there are signs of bouncing, and there may be a higher low. Of course, this has not yet been confirmed, and price has not quite achieved its daily range. Nonetheless, a trigger that might be possible is a two-bar reversal, which is the situation where price breaks the highest high of the previous two closed bars. This should enable traders to enter at relatively low prices and to ride any larger move with a stop below the recent true low.
Of course, it may be that price will rise rapidly without giving time for traders to secure a safe entry with a small stop loss. In that case, this trade should be considered a relative side show, and be skipped completely.
Author

Kaye Lee
Straight Talk Trading
Kaye Lee holds an MA in Economics and Law from the University of Cambridge. He is the Head Trader Consultant for Straight Talk Trading and Trades Happening Now.


