GBP/USD will need to break hard resistance for the next rally — Confluence Detector


The GBP/USD continues holding the high ground on the optimism related to Brexit and amid top-tier UK data. What's next? 

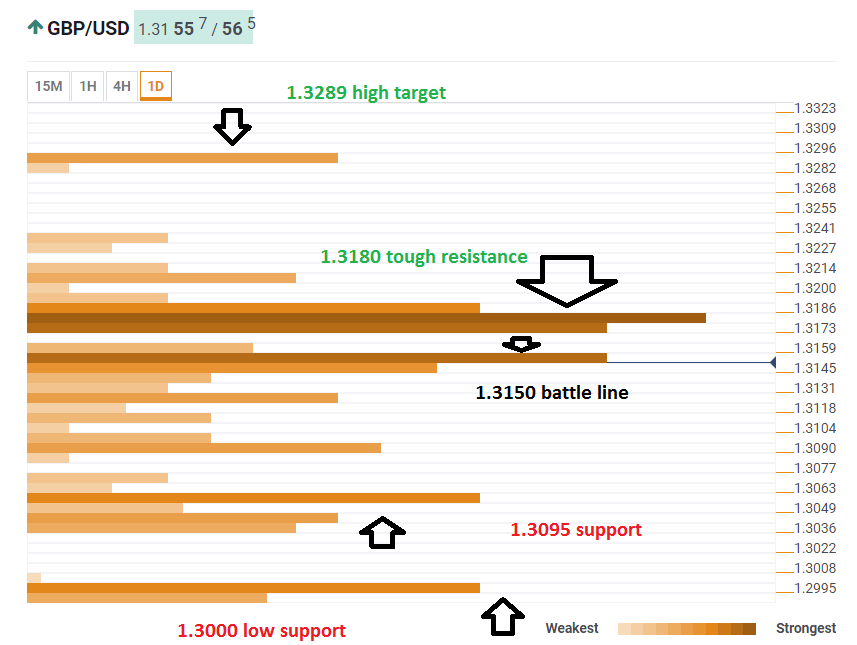
The Technical Confluences Indicator shows that the GBP/USD is battling a dense congestion of resistance lines around 1.3150 where we see the Simple Moving Average 100-15m, the SMA 5-1h, the Bolinger Band 15m-Middle, the BB 1h-Middle, the SMA 50-15m, the SMA 10-15m, the SMA 10-1h, the SMA 10-4h, the Fibonacci 38.2% one-day, the Fibonacci 61.8% one-day, and quite a few other lines.

Moving up and getting out of the dense area will send cable to tough resistance at 1.3180 where we see the convergence of the Pivot Point one-month Resistance 1, the Pivot Point one-day Resistance 1, the Pivot Point one-week Resistance 1, the Bolinger Band 1h-Upper, and the SM 100-one-day.

If cable overcomes this line, the door is open to running much higher, with the first noteworthy upside target at 1.3289 where we see the Pivot Point one-week Resistance 2. 

Looking down, support awaits at 1.3095 where we see the Pivot Point one-day Support 2 and the Fibonacci 23.6% one-week.

It is followed by the round number of 1.3000 which is the meeting point of the SMA 100-4h, the SM 50-one-day and the Fibonacci 61.8% one-week.

This is how it looks on the tool:

GBPUSD Technical confluence September 19 2018

Confluence Detector

The Confluence Detector finds exciting opportunities using Technical Confluences. The TC is a tool to locate and point out those price levels where there is a congestion of indicators, moving averages, Fibonacci levels, Pivot Points, etc. Knowing where these congestion points are located is very useful for the trader, and can be used as a basis for different strategies.

This tool assigns a certain amount of “weight” to each indicator, and this “weight” can influence adjacents price levels. This means that one price level without any indicator or moving average but under the influence of two “strongly weighted” levels accumulate more resistance than their neighbors. In these cases, the tool signals resistance in apparently empty areas.

Learn more about Technical Confluence

Information on these pages contains forward-looking statements that involve risks and uncertainties. Markets and instruments profiled on this page are for informational purposes only and should not in any way come across as a recommendation to buy or sell in these assets. You should do your own thorough research before making any investment decisions. FXStreet does not in any way guarantee that this information is free from mistakes, errors, or material misstatements. It also does not guarantee that this information is of a timely nature. Investing in Open Markets involves a great deal of risk, including the loss of all or a portion of your investment, as well as emotional distress. All risks, losses and costs associated with investing, including total loss of principal, are your responsibility. The views and opinions expressed in this article are those of the authors and do not necessarily reflect the official policy or position of FXStreet nor its advertisers. The author will not be held responsible for information that is found at the end of links posted on this page.

If not otherwise explicitly mentioned in the body of the article, at the time of writing, the author has no position in any stock mentioned in this article and no business relationship with any company mentioned. The author has not received compensation for writing this article, other than from FXStreet.

FXStreet and the author do not provide personalized recommendations. The author makes no representations as to the accuracy, completeness, or suitability of this information. FXStreet and the author will not be liable for any errors, omissions or any losses, injuries or damages arising from this information and its display or use. Errors and omissions excepted.

The author and FXStreet are not registered investment advisors and nothing in this article is intended to be investment advice.

Recommended Content


Recommended Content

Editors’ Picks

EUR/USD hovers near 1.0700 even as USD struggles ahead of data

EUR/USD hovers near  1.0700 even as USD struggles ahead of data

EUR/USD has erased gains to trade flat near 1.0700 in the European session on Thursday. The pair comes under pressure even as the US Dollar struggles, in the aftermath of the Fed policy announcements and ahead of more US employment data. 

EUR/USD News

GBP/USD turns south toward 1.2500, US data eyed

GBP/USD turns south toward 1.2500, US data eyed

GBP/USD is consolidating the rebound above 1.2500 in European trading on Thursday. The pair struggles, despite the US Dollar weakness on dovish Fed signals. A mixed market mood caps the GBP/USD upside ahead of mid-tier US data. 

GBP/USD News

Gold price pulls back as market sentiment improves

Gold price pulls back as market sentiment improves

The Gold price is trading in the $2,310s on Thursday after retracing about three-tenths of a percent on reduced safe-haven demand. Market sentiment is overall positive as Asian stocks on balance closed higher and Oil prices hover at seven-week lows. 

Gold News

Top 3 Price Prediction BTC, ETH, XRP: Altcoins to pump once BTC bottoms out, slow grind up for now

Top 3 Price Prediction BTC, ETH, XRP: Altcoins to pump once BTC bottoms out, slow grind up for now

Bitcoin reclaiming above $59,200 would hint that BTC has already bottomed out, setting the tone for a run north. Ethereum holding above $2,900 keeps a bullish reversal pattern viable despite falling momentum. Ripple coils up for a move north as XRP bulls defend $0.5000.

Read more

Happy Apple day

Happy Apple day

Apple is due to report Q1 results today after the bell. Expectations are soft given that Apple’s Chinese business got a major hit in Q1 as competitors increased their market share against the giant Apple. 

Read more

Majors

Cryptocurrencies

Signatures