GBP/USD Weekly Forecast: With UK economy decelerating, rate hike in May is a joking option

- Sterling fell 600 pips off the cyclical high from April 17 after the UK growth data press the Bank of England to hike the rates later than on May.
- The macro data scheduled for the UK and the US are seen supporting US Dollar further as the non-farm payroll is expected to deliver another strong employment rise.
- Technically the oversold condition indicates short-term correction that is likely to be limited given the fundamental development.
While Sterling lost some 370 pips during the third week of April with the UK wage growth, inflation and the retail sales disappointing, relative foreign exchange rate stability at the beginning of the fourth week of April was finally buried by increasing US benchmark Treasury yields and a huge miss in the UK GDP data. The expectations of the Bank of England raising the Bank rate as early as May 10, 2018, that had driven Sterling higher previously were quickly scaled down.
The GBP/USD opened the fourth week of April at the brink of 1.4000 and it fell all the way down to 1.3747 by Friday last week losing some 600 pips since its cyclical peak and 22-month high made on April 17, just two weeks ago. While the GBP/USD traded in a tight range of 1.3920-1.4030 during the first three days of last week, the real push on the currency pair came on Friday with rather disappointing UK GDP growth that rose 0.1% Q/Q compared with 0.4% Q/Q expected. The GBP/USD lost some 1.2% on Friday only falling past 1.3900 and 1.3800 all the way down to 1.3747.
The UK first quarter data were disappointing the market expectation with 0.1% Q/Q growth recorded while the UK economy increased 1.2% over the year. The high hopes of interest rate hike in May look currently unjustified and mostly dovish Monetary Policy Committee of the Bank of England is now expected to stand pat on rates after first rate increase in last decade in November 2017.
Technically the GBP/USD is deeply in the oversold territory with some room for short-term correction, but given the economic calendar, no many fundamental drivers appear on the horizon to lift Sterling from the lowest level since the beginning of March. The growth differential between the UK and the US was even more pronounced after the US first-quarter GDP surprised on the upside rising 2.3% Q/Q annualized.
While the downside move on GBP/USD looks increasingly exhausted with the currency pair bouncing off lows of 1.3747 with the support of 50% Fibonacci retracement line of the previous move from 1.3040 to 1.4377, there are only minor news for the UK in the economic calendar for the next week to drive it higher. On the other hand, the US will see the combination of strong employment data likely to extend further in April driving the expectations of the continuous US rate hiking cycle.
Moreover, the political developments in the UK did not provide enough support for Sterling. The House of Lords has repeatedly defeated the Prime Minister Theresa May’s policies in the parliament on a different issue regarding the Withdrawal bill with Lords conditioning the UK to remain part of the customs union with the EU even after Brexit being politically the toughest option.
GBP/USD 1-hour chart
-636604397071757898.png)
Related story
GBP/USD Forecast: Sterling set to suffer further downside with GDP growth disappointing
Technical analysis
GBP/USD weekly chart
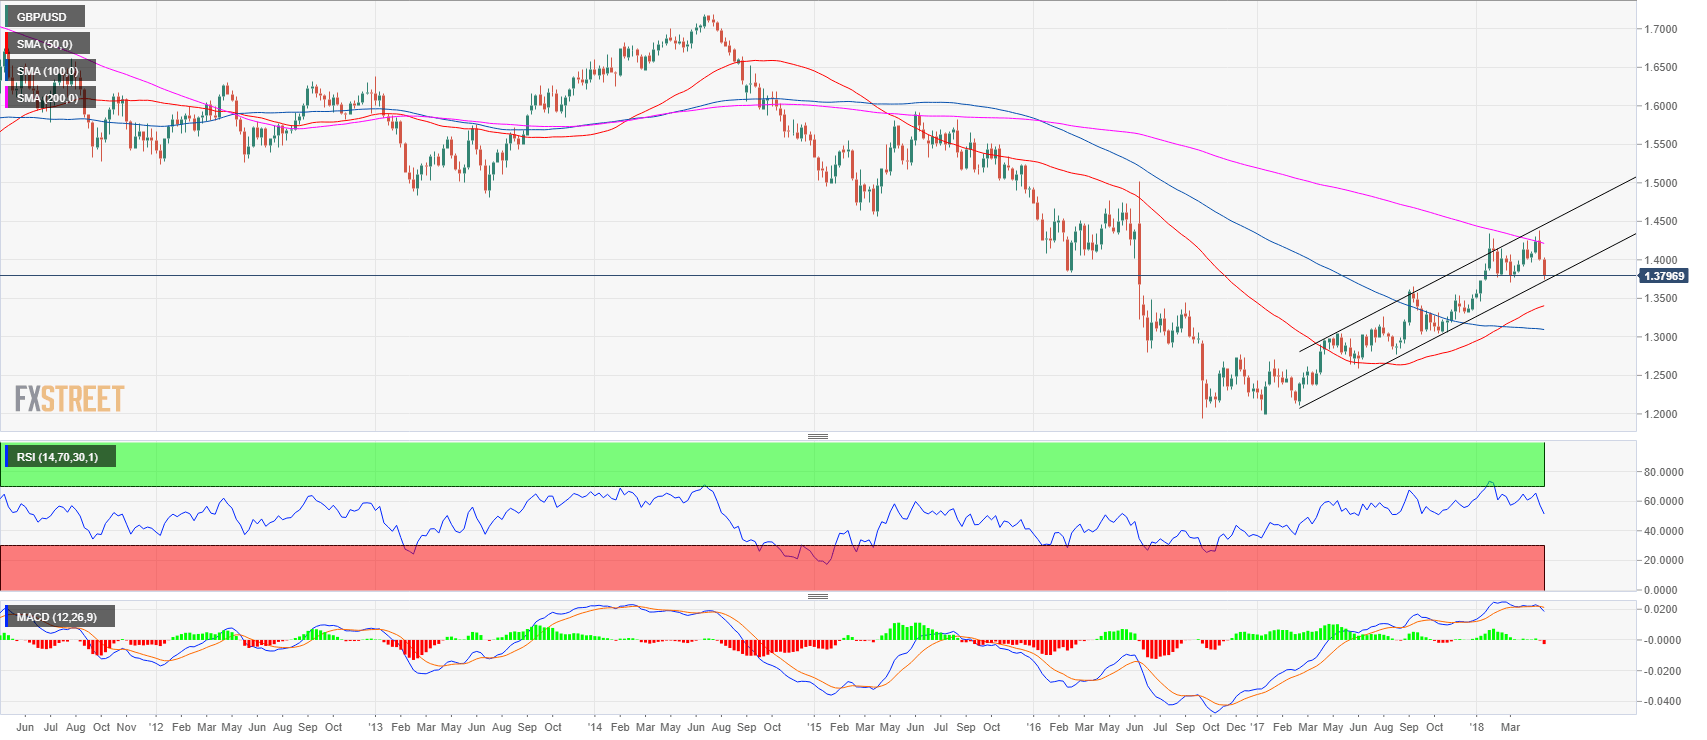
The GBP/USD on the weekly chart is still technically in a bull channel, however, the double top at the 1.4377 level together with the previous this year’s high, put the cable under heavy pressure. The market failed to breach the 200-period simple moving average on the weekly time frame which sparked a strong bearish reaction. The GBP/USD is now confronting the ascending bull trend line and the 1.3711 swing low. A break to the downside could lead to 1.3658 swing high (September 2017) and 1.3310 swing low (December 2017). To the upside, the main resistance is the 1.4000 figure which acted as an important pivot and the high of the year at 1.4377 level. The momentum is bearish with the Relative Strength Indicator (RSI) pointing downwards much like the Moving Average Convergence/Divergence (MACD) indicator.
GBP/USD daily chart
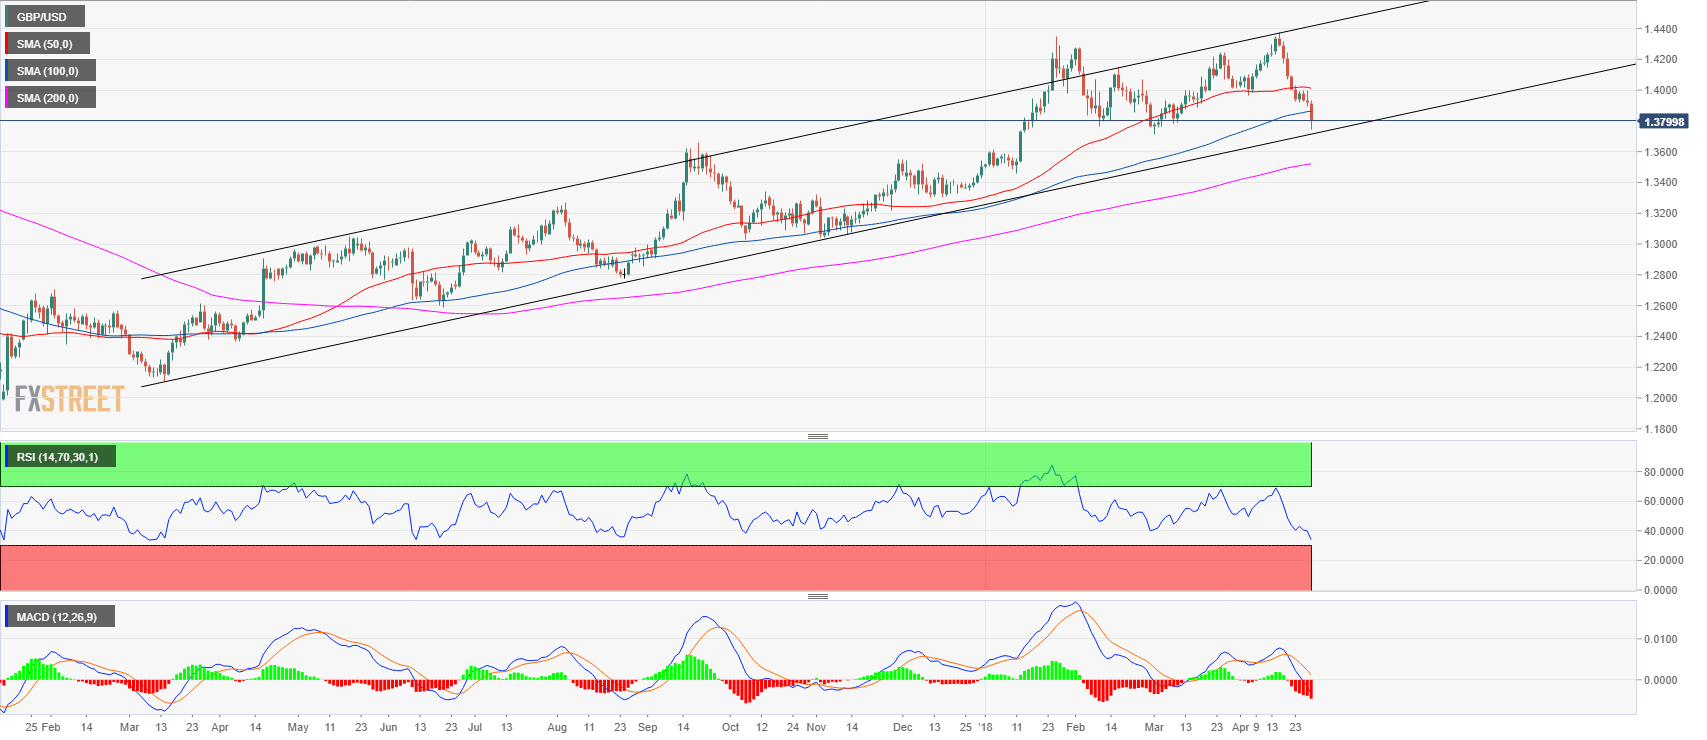
The market broke below the 50 and 100-period simple moving averages on the daily time frame on GBP/USD confirming the bearish trend. However, the bears will need to break below the 1.3711 swing low (March 1) and below the ascending bull trend line to claim their victory over the Sterling bulls. While a strong reversal up seems unlikely given the strong bearish momentum, Sterling bulls can hope to create a trading range in the 1.3800 region and maintain the market above the ascending bull trend line and the 200-period simple moving average. A break below the 1.3711 swing low can open the gates to the 1.3600 figure level which is also a previous demand zone and further down the 1.3300 swing low (December 15) which can come into play. If the bulls manage to break above the 1.4000 handle, the bears will likely be tempted to lighten up their short positions and the bear trend could be in peril as the next significant level would become the 1.4200 figure.
GBP/USD 4-hour chart
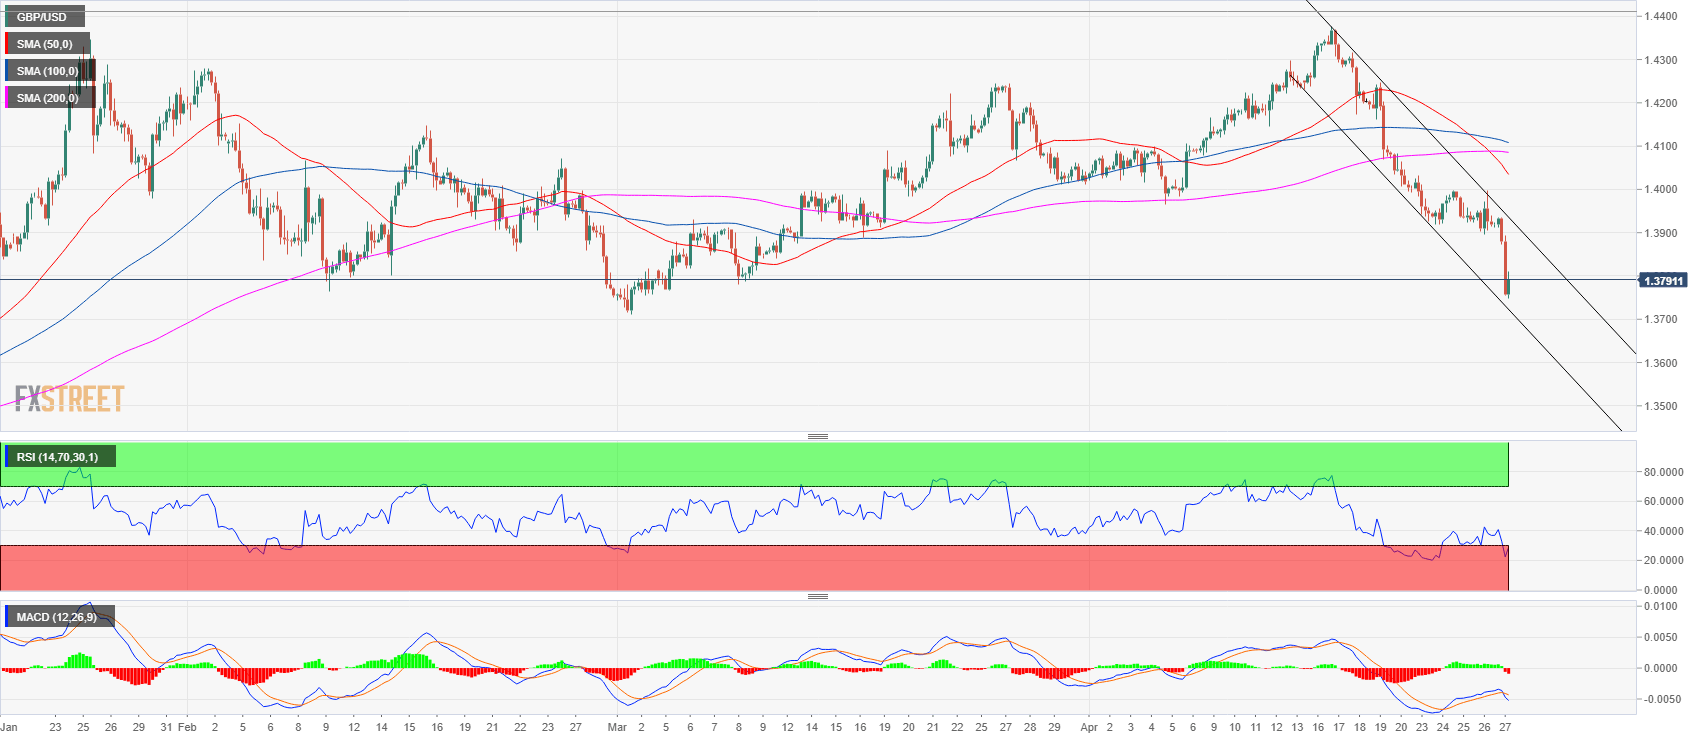
The cable on the 4-hour time frame is trading below its 50, 100 and 200-period simple moving averages confirming the bear trend. The last bear leg was strong and the market is consolidating in the bear channel. The bear trend is well in place with the RSI in oversold territories and the MACD showing bearish momentum.
Upcoming macro data
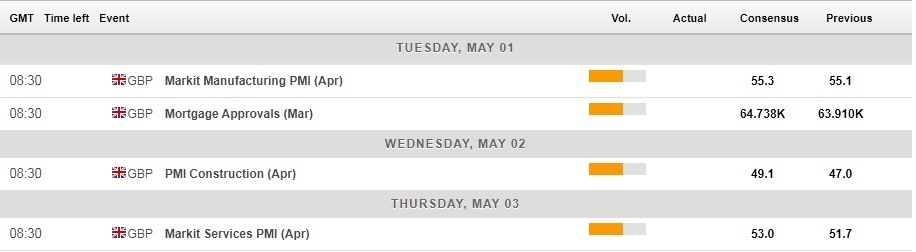
Unlike the UK, the macroeconomic calendar is pretty much empty for the UK in the upcoming week with the manufacturing and services purchasing managers’ indices (PMI) headlining the week ahead. Both manufacturing and services OMIs are expected to increase slightly in April within the territory of the economic expansion, nut the construction PMI is still expected to remain in the territory indicating economic contraction. Given the fact that the construction industry represented the biggest drag on the UK GDP in the first quarter, the prospects for the UK growth with construction PMI still in contraction territory are rather negative and giving the Bank of England reason to remain dovish even after May Inflation report.
The UK economic calendar for April 30-May 4
Looking on the other side of the Atlantic and the economic calendar in the week ahead is headliner by the FOMC meeting and the April labor market report. Although the Federal Reserve is not expected to raise rates in May, the main message from the meeting is set to confirm previous signals from the individual Fed board members or the regional Fed Presidents that all expect 3 rates hikes to come this year. This is strengthening the case of Fed going forward with the rate hike in its meeting in June, along with news dot-plot released and further data to come.
The US economic calendar for April 30-May 2
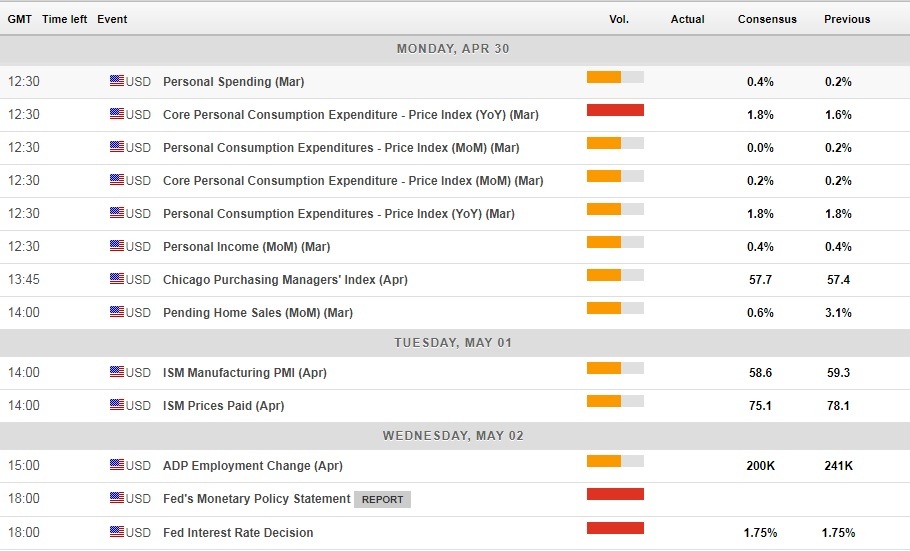
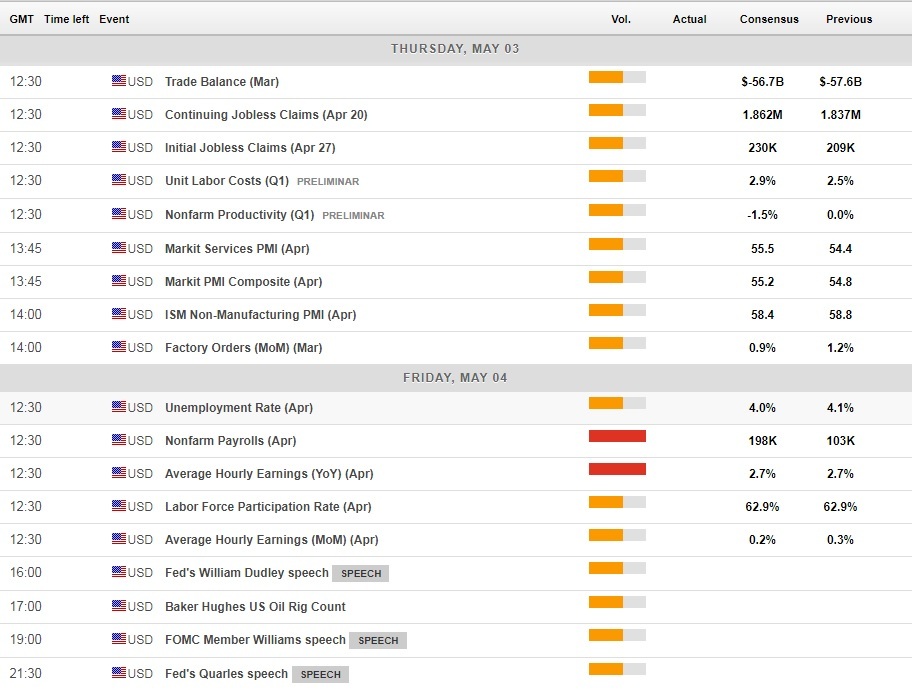
The economic calendar for the US will also deliver the core Personal Consumption Expenditure inflation figures that are used as a proxy for inflation and of course the April non-farm payroll report on Friday. The forerunner of the government’s non-farm payroll report will be published on Wednesday, May 2, with the total number of new jobs created reaching 200K in ADP’s private employment report for April. The Labor Department’s employment report is expected to deliver 198K news jobs while the unemployment rate is expected to further drop to 4.0% in April. The most important factor of future inflation is the wage growth that is expected to increase by 2.7% y/y in April, unchanged from March.
The US economic calendar for May 3-May 4
Forecast for next week
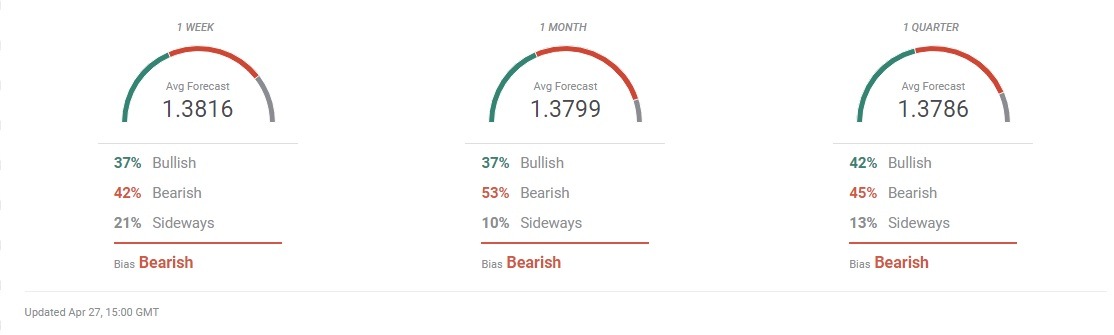
The FXStreet Forecast Poll expected the GBP/USD to stay at 1.4038, just above the psychological level of 1.4000 in the one-week horizon with the sideways trend to be expected. The GBP/USD though fell further down as low as 1.3747 during the week recovering to 1.3770 level by the end of Friday.
For the next week, the FXStreet Forecast Polls also expects the sideways trend to prevail with the median forecast of 1.3816 by the end of next week. Majority of forecasters expect the bearish trend to prevail (42%) while 37% expect the bullish trend in one week time.
After the GBP/USD fell some 600 pips off its cyclical peak of 1.4377 on April 17 and the main market expectations of May rate hike by the Bank of England are scaled back after disappointing growth date, longer-term bearishness is warranted.
The FXStreet Forecast Poll reflects market turning nearish expecting 1.3799 in one month time from now while 1.3786 is the median estimate for three months from now.
FXStreet Forecast Poll
Author

Mario Blascak, PhD
Independent Analyst
Dr. Mário Blaščák worked in professional finance and banking for 15 years before moving to journalism. While working for Austrian and German banks, he specialized in covering markets and macroeconomics.


