GBP/USD Weekly Forecast: Clearance of smoke curtain on the rate hike front supports Sterling

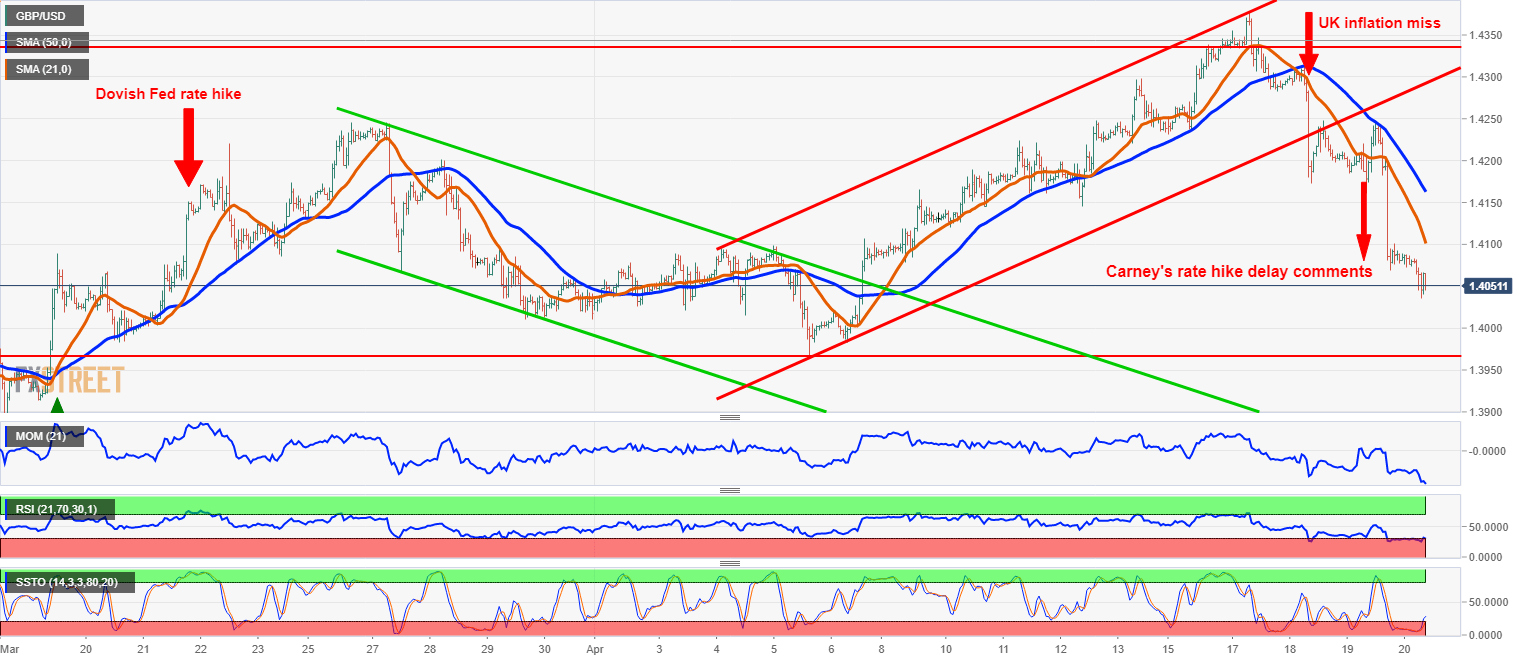
Increasing market conviction of the Bank of England raising the Bank rate on May 10, 2018, was the main driver behind Sterling’s appreciation in last two weeks, but the third week of April was very stormy for GBP/USD that rose to 22-month high on Tuesday morning just to be sold off more than 340 pips lower in just three trading days. Even with the trinity of the most important macroeconomic indicators in the UK all missing the expectations last week and the Bank of England Governor Carney applying the strategy of a smoke curtain while speaking about the rate hike prospects, the scenario of the Bank of England raising the Bank rate in May is still the central market projection that will drive Sterling higher in the weeks ahead.
Majority of the market participants expecting the rate hike in May is slimmer after the week of disappointing data Governor Carney’s verbal intervention. Still, rate hike believers pushed Sterling to new post-Brexit high and once the smoke curtain of disappointing macro data fand Brexit uncertainty clears out, the prospects for the rate hike will come back into plays.
The rationale behind the expectations of the Bank of England raising rates in May is justified by inflation decelerating faster towards the 2% inflation target with core inflation being of the target just by 0.3% and even more importantly by the wage growth is the fastest since September 2015 and satisfies the Bank of England policymakers as well.
On Friday the Bank of England Monetary Policy Committee member Michael Saunders said that the latest average earnings data were as expected, with inflation driving factors appear to be shifting away from external to domestic.
While depreciation of GBP/USD from post Brexit high of 1.4377 to 1.4030 was a result of the combination of lower than expected macro data, the House of Lords voting in favor of the UK remaining in customs union with the EU after Brexit with vast majority and the Carney’s comments, should the market realise that the rate hike is still in play, correction higher is set to target 1.4245 level representing March 26 high.
With the first quarter GDP being the only important macroeconomic indicator during the fourth week of April that is expected to increase 0.4% quarterly and the return of the rate hike sentiment in combination with technically oversold market also favor correction on higher levels for GBP/USD, as long as the pair holds above key support levels of
GBP/USD 1-hour chart
Last week in a nutshell
With the Bank of England interest rate hike being the major FX market driver for GBP/USD in last few weeks, the latest round of the UK macroeconomic indicators was a test of patience for the policymakers.
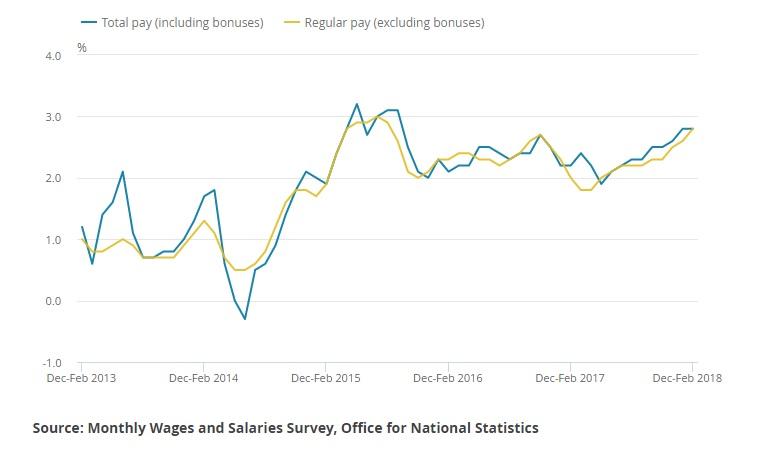
The first important indicator last week was the March labor market report that saw the closely watched wages rise less than expected in three months to February. Although the wage growth as the key element of the labor market report missed the market expectations three months to February, the nominal wage development is still positive in real, inflation-adjusted terms as inflation rose 2.7% y/y while wages including bonuses rose 2.8%, rising faster than inflation for the first time since January 2017 when inflation reached 1.8% y/y while wages rose 2.2% y/y.
With the sharp depreciation of Sterling and its negative effect on rising inflation in the UK now dissipating, the Bank of England will focus on long-term prospects for inflation stemming from the tight labor market and therefore the combination of inflation and labor market data are the key to unlock the monetary policy prospects puzzle.
UK nominal wage growth y/y
Moreover, the unemployment rate in the UK dropped to 4.2% in three months to February, the lowest level since 1975, making the whole feeling of the report less harmful. The Bank of England Monetary Policy Committee member Michael Saunders said on Friday that the UK no longer needs as much stimulus as before, due to little economic and slack and rising cost pressures. Saunders also said the latest average earnings data were as expected, with inflation appears to be shifting away from external to domestic inflation drivers. The Bank of England Monetary Policy Committee member Ian McCafferty is the second MPC member with Saunders that has indicated his willingness to hike rates in March saying that the wage growth is a fundamentally more important driver of the UK inflation justifying the rate hike in May.
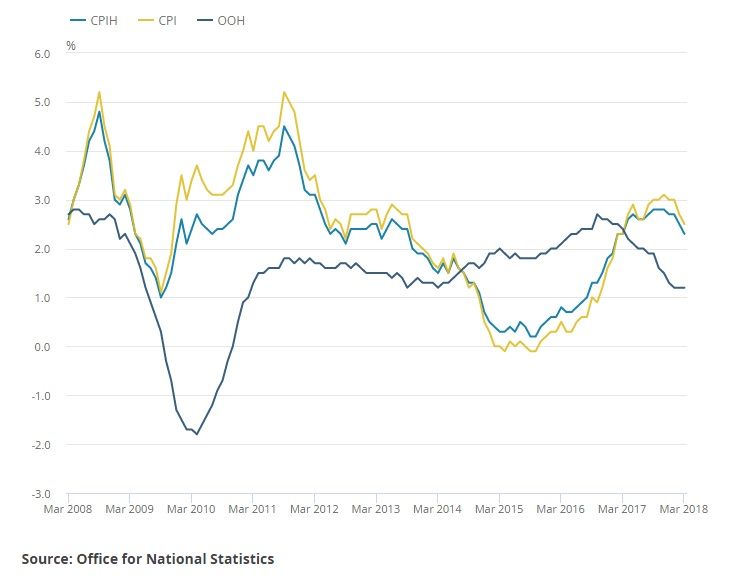
On Wednesday, the UK inflation rose 2.5% over the year in March, missing the forecast of 2.6% y/y increase while core inflation decelerated to 2.3% y/y.
UK inflation indices
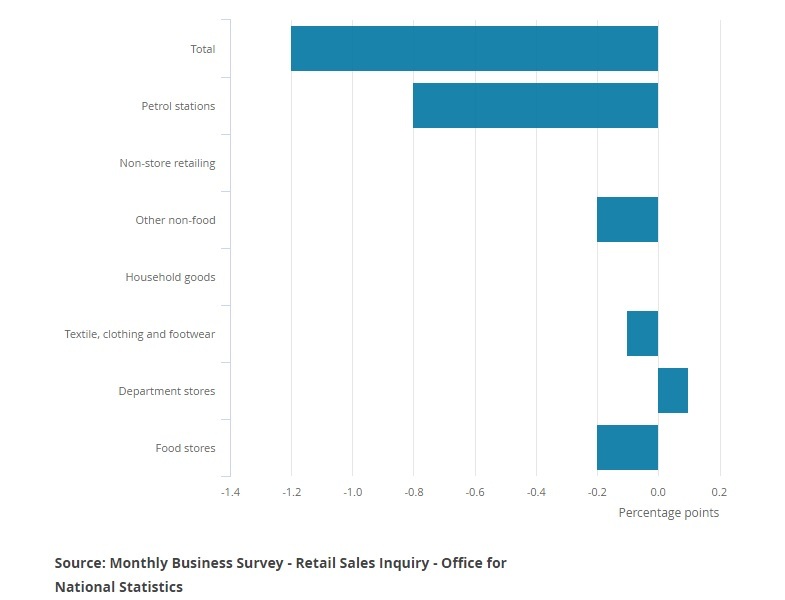
The trinity of the disappointing macroeconomic indicators in the UK was filled with the UK retail sales report that saw total retail sales falling -1.2% over the month in March while core retail sales excluding motor fuel sales fell -0.5% m/m. Looking at the retail sales from the broader quarterly view, retail sales in the first quarter fell -0.5% Q/Q knocking some 0.03 percentage point off Q1 UK GDP growth.
Contributions to the UK retail sales on a monthly basis
Related stories
- The end of the darkness for real wages in the UK
- Decelerating UK inflation is not changing the view of the Bank rate rise in May
Technical analysis
GBP/USD weekly chart
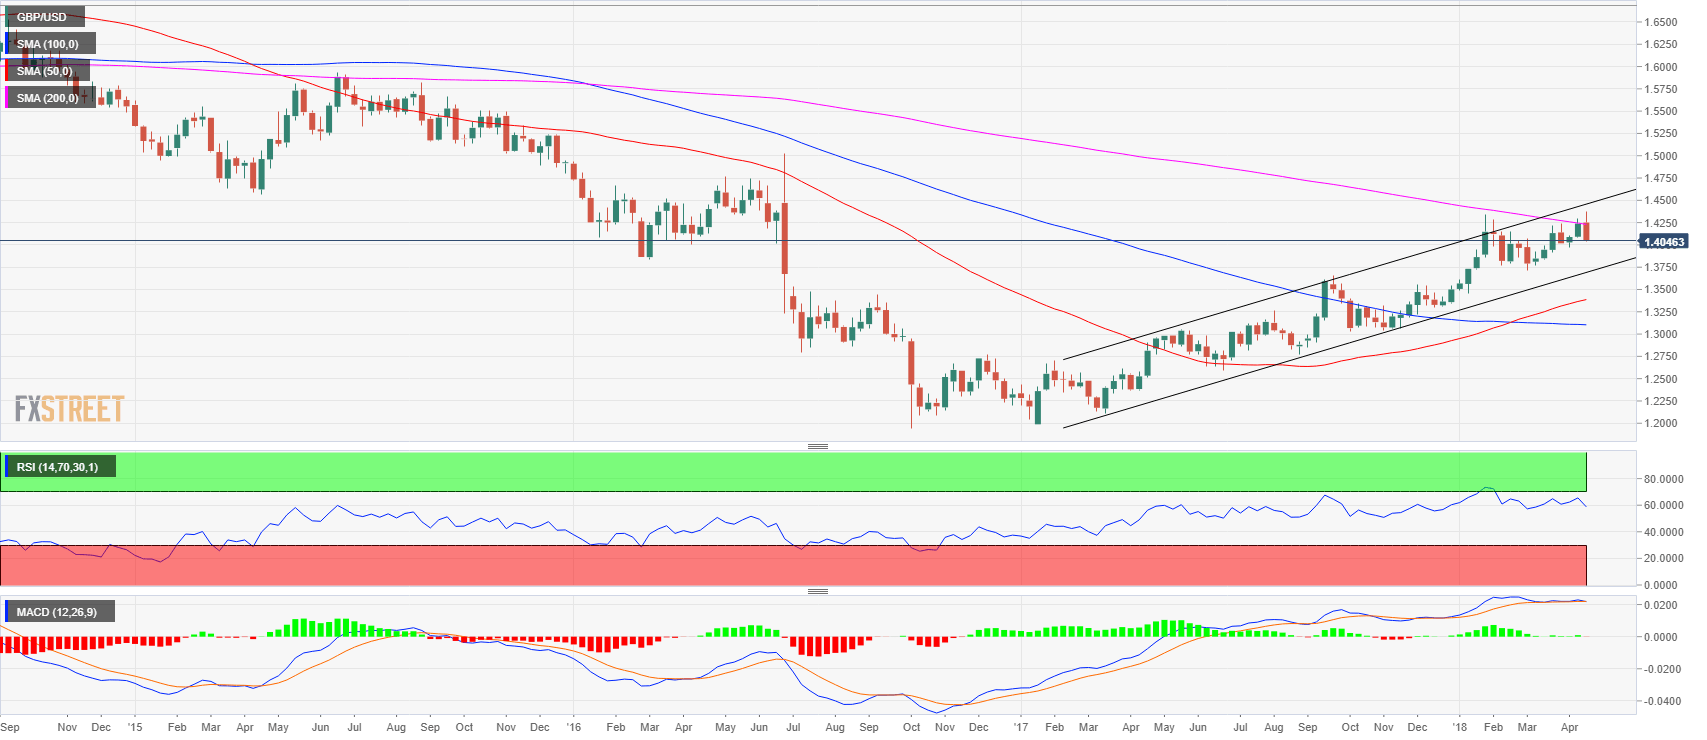
The GBP/USD was rejected at the 200-period simple moving average at the weekly chart that is located at 1.4230. By the same token, the market made a false breakout above the yearly high made on January 25 at 1.4346 where it found massive resistance. The pair reversed down sharply after reaching new 2018 high of 1.4377 on Tuesday. The bears are currently trying to close below last week’s low at 1.4078. The current broader weekly trend is still up but the recent double top suggests that the pullback down can extend lower towards 1.3710 swing low made in early March. If 1.3710 level fails prices are set to retest the 1.3500 handle, previous demand zone that would be the next key support to watch. Further upside opens up if the bulls manage to reclaim the yearly high at 1.4377 and push through the 1.4400 handle targeting 1.4500 and 1.5000 next. Both the Relative Strength Index (RSI) and Moving Average Convergence / Divergence (MACD) indicators suggest that the bullish momentum is slowing down.
GBP/USD daily chart
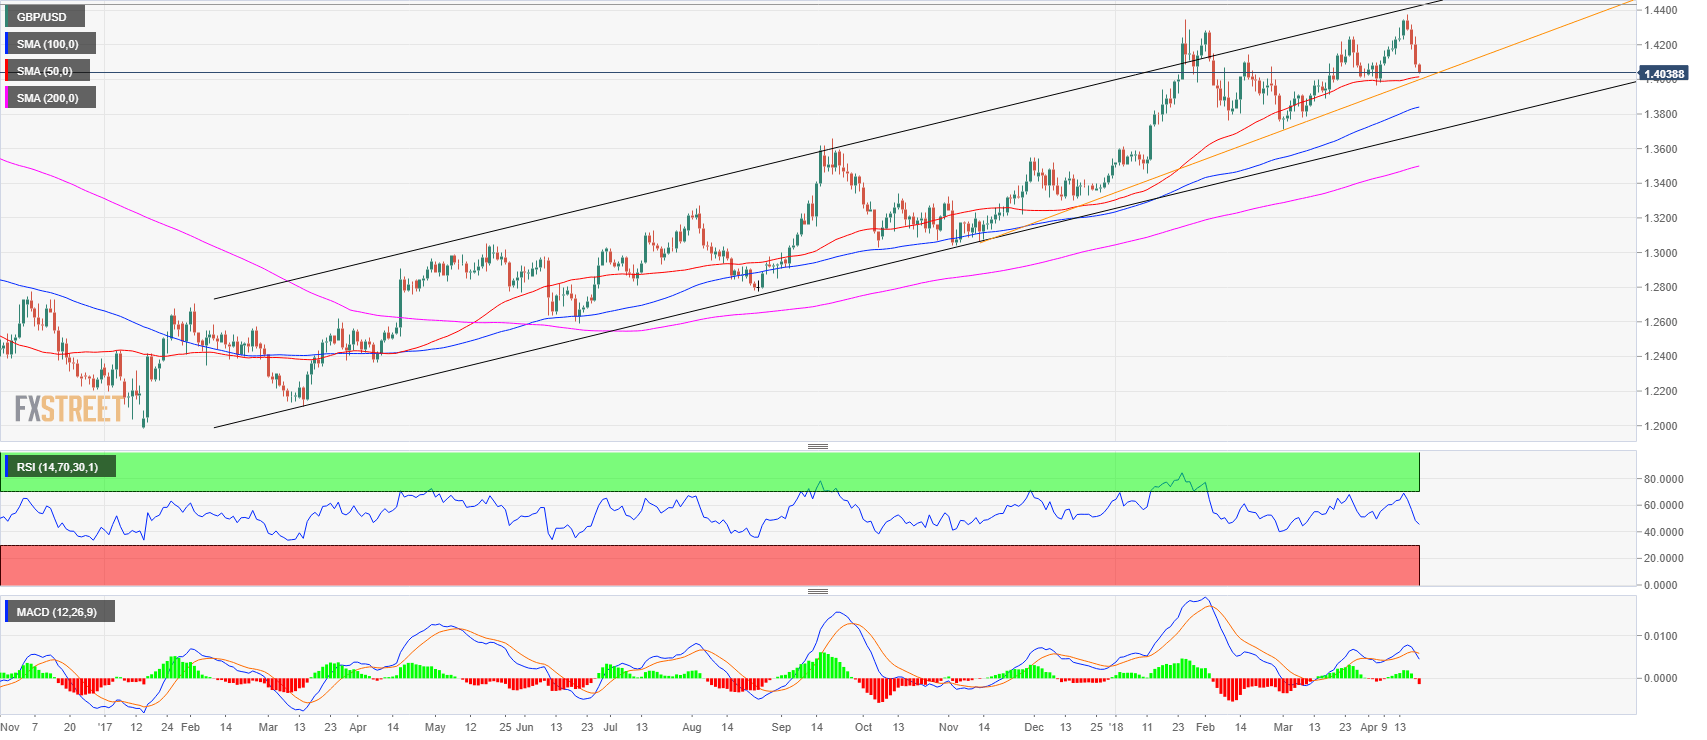
The GBP/USD made a new 2018 high at 1.4377 on Tuesday and it was hammered lower more than 340 pips in four consecutive days of losses. The reversal was sharp and strong and sent the RSI and MACD indicators in bearish territories. The cable is currently approaching a potential support zone at the 1.4000 handle and 1.3965 swing low (April 5). The 50-period simple moving average (SMA) is located at 1.4014 which then creates a confluence zone defined between the 1.3965 (April 5 low) and the 1.4014 level (50-period SMA). Also worth noting is the ascending bullish trendline (orange line) which can also collaborate to provide some support. A break below 1.3965-1.4014 zone could open the gates to 1.3711 swing low established on March 1. Alternatively, to the upside investors can expect resistance at the 1.4245 level (March 26 high) and at the yearly high at the 1.4377 level.
GBP/USD 4-hour chart
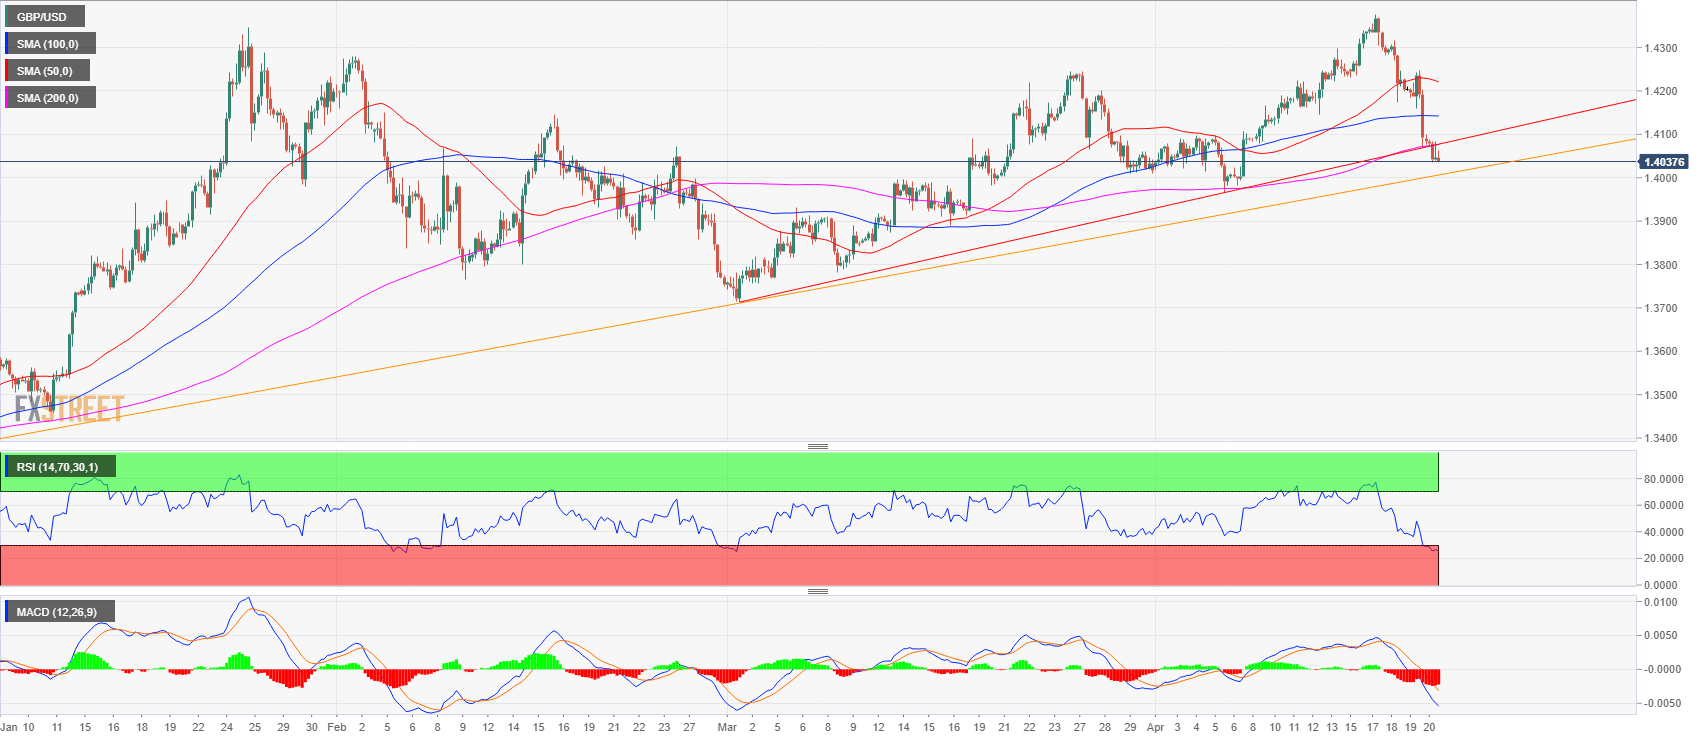
On the 4-hour time frame, the cable broke below the 50, 100 and 200-period simple moving averages with a strong bearish momentum sending the RSI and MACD in bearish territories not seen since early March. The market also broke below a bullish trend line (red line) adding selling pressure to the pair. The sterling is soft and the market will need to decide what happens in the 1.3965-1.4014 support zone.
Upcoming macro data
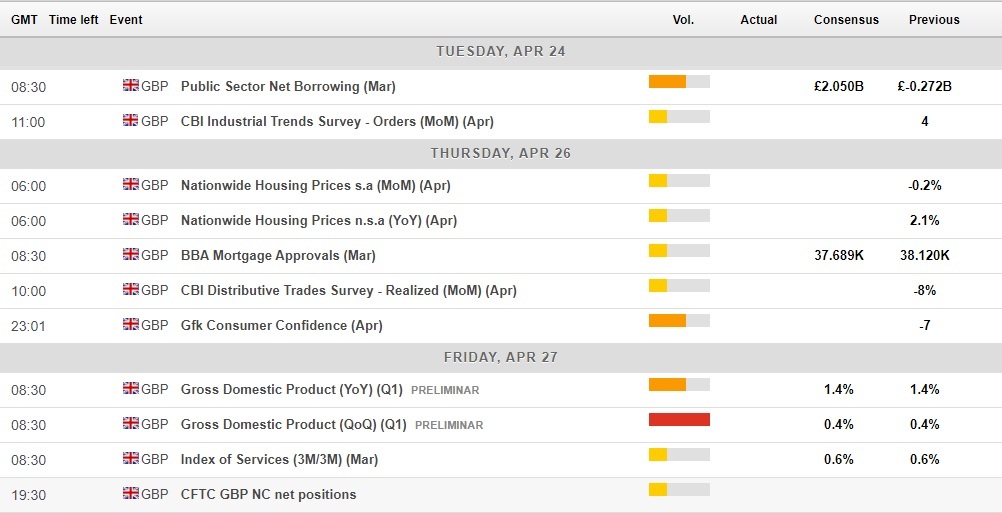
There is only one really important piece of the macroeconomic release in the UK in the upcoming week and that is the first quarter 2018 GDP report due next Friday, April 27. The UK GDP is expected to rise 0.4% on a quarterly basis while rising 1.4% over the year. With GDP being typical backward-looking indicators, the news might not a decisive factor to influence the GBP/USD market. It is the monetary policy outlook that is expected to decide upon Sterling long-term destiny.
The Bank of England MPC member Michael Saunders said the Bank expects the annual GDP growth over next two years to remain at 1.5%-2.0%, marginally above potential. Saunders expects labor market inflation pressures to be a bit greater than the Bank of England forecast in February Inflation Report with the significance of data pointing to soft Q1 growth being "questionable" due to adverse weather conditions and the history of upward revisions.
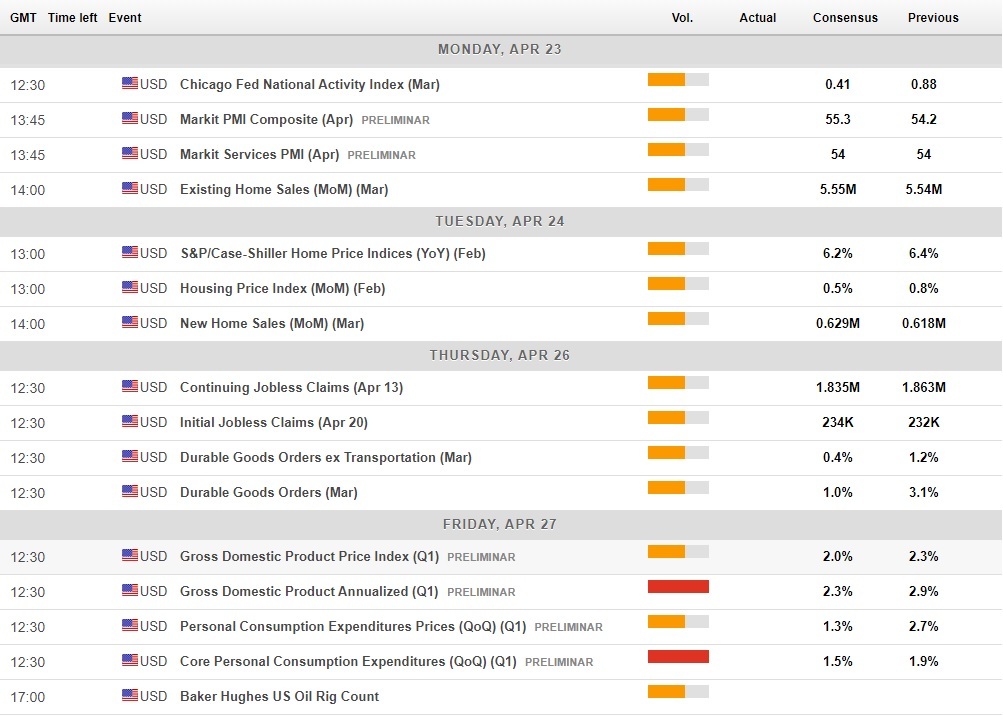
The UK economic calendar for April 23-27
Looking on the other side of the Atlantic and the economic calendar scheduled, the headline data are also due to be released on Friday. The first quarter US GDP is expected to rise 2.3% on a quarterly annualized basis, down from upwardly 2.9% rise in the final quarter of 2017. Here again, the GDP release will be overshadowed by the Personal Consumption Expenditure (PCE) core inflation measure that is by far the most important measure of inflation for policymakers at the Federal Reserve Bank.
The monetary policy divergence between the Bank of England and the Federal Reserve Bank is a very important factor on the FX market and regarding the communication, the message both central banks are sending different messages. While the US Federal Reserve officials are clear and straightforward in their communication of gradual monetary policy normalization in the US, the Bank of England official are sending a bit foggy signals, a partial reason for the GBP/USD to retreat lower this week.
The US economic calendar for April 23-27
Forecast for next week
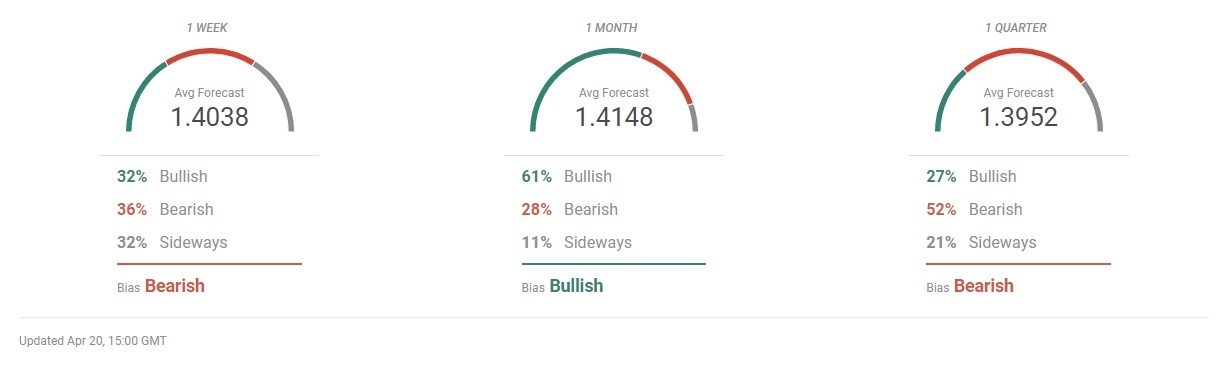
While the spot is trading at around 1.4030 and analysts and economists participating in FXStreet Forecast Poll expect the GBP/USD to stay at 1.4038, just above the psychological level of 1.4000 in the one-week horizon, the sideways trend is expected to prevail in one week time from now. Unlike the median FXStreet Forecast Poll expecting a sideways trend, I expect a correction on GBP/USD towards 1.4200 level in a week ahead, especially as the FX market realizes that the 350 pips selloff this week was just too much. The technical picture is complemented by the fundamental overview in which I believe that the policymakers are looking at the 2-3 years horizon from now in terms of meeting their inflation target and knowing that the UK labor market is tight producing a lot of aggregate drive to push nominal wages higher that will eventually become a bigger threat to inflation than the previous Sterling depreciation related inflation jump.
FXStreet Forecast Poll
Author

Mario Blascak, PhD
Independent Analyst
Dr. Mário Blaščák worked in professional finance and banking for 15 years before moving to journalism. While working for Austrian and German banks, he specialized in covering markets and macroeconomics.


