GBP/USD weekly double top pattern, long term target 1.3100 [Video]
![GBP/USD weekly double top pattern, long term target 1.3100 [Video]](https://editorial.fxstreet.com/images/Markets/Currencies/Majors/GBPUSD/iStock-900067218_XtraLarge.jpg)
Overview
Watch the video for a summary of today’s news releases, a review of the USD Index, and a complete Top-Down Analysis of the GBPUSD.
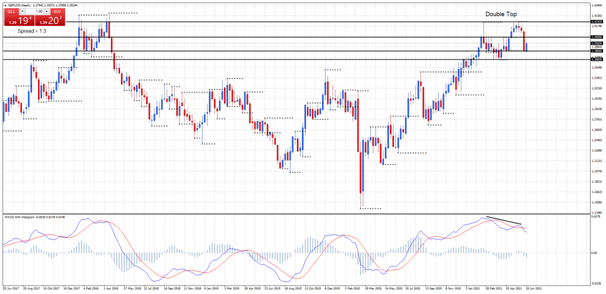
GBP/USD weekly
Weekly support at 1.3800 and 1.3669, resistance at 1.4009 and 1.4242.
Price last week broke below 1.4009 weekly support with strong conviction after the release of the US FOMC Statement. The weekly double top pattern is now forming and MACD is showing negative divergence confirming the reversal.
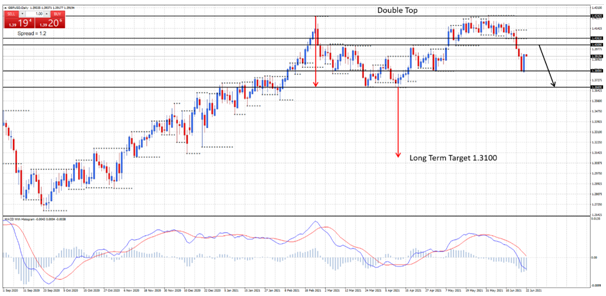
GBP/USD daily
Daily support at 1.3800, a daily resistance at 1.4009, and 1.4063.
Price is in a clear downtrend on the daily chart showing a lower top and lower bottoms. Last week finished with 3 straight days down in a row showing heavy selling.
Ahead of the UK interest rate decision on Thursday price may rally back up. Expect the 1.4000 level to now act as a strong resistance level, offering the opportunity to take a position for the next decline.
Long-term targets for the double top pattern would be 1.3669 weekly support and then 1.3100 should 1.3669 weekly support be taken out.
Premium
You have reached your limit of 3 free articles for this month.
Start your subscription and get access to all our original articles.
Author

Duncan Cooper
ACY Securities
Duncan Cooper is a full-time trader and mentor. He has been actively trading the financial markets for more than 15 years and has traded stocks, options, futures, and the Forex Market since 2005.


