GBP/USD rose after UK PM Theresa May announced she is making an attempt to break the logjam and reached out to Labour leader Jeremy Corbyn to find a solution. Technical levels are also hopeful for a solution.
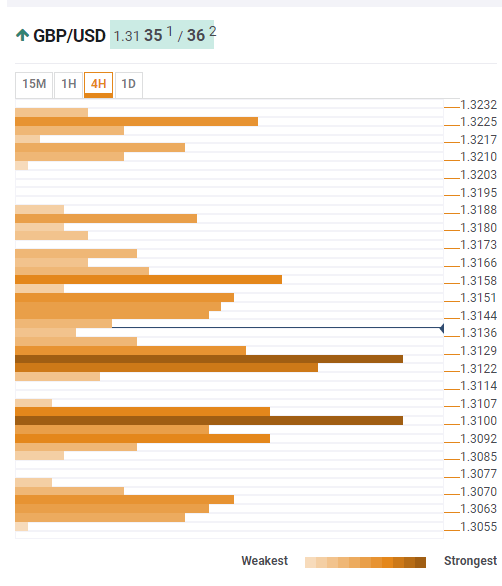
The Technical Confluences Indicator shows that cable enjoys significant support at 1.3125 which is the convergence of the Fibonacci 38.2% one-month, the Fibonacci 23.6% one-day, and the Bollinger Band 15min-Lower.
If it breaks lower, further support awaits at 1.3100 where we see the confluence of the BB 1h-Middle, the Fibonacci 38.2% one-day, and the Simple Moving Average 50-one-day.
All in all support is quite substantial.
On the other hand, resistance clusters are weaker. At 1.3158 we see the meeting point of the Bollinger Band 4h-Upper, the Fibonacci 61.8% one-week and the previous daily high.
The next noteworthy juncture is only at 1.3225 where we see the Fibonacci 61.8% one-month, and the Pivot Point one-week R2 converge.
So, the path of least resistance is to the upside.
This is how it looks on the tool:
Confluence Detector
The Confluence Detector finds exciting opportunities using Technical Confluences. The TC is a tool to locate and point out those price levels where there is a congestion of indicators, moving averages, Fibonacci levels, Pivot Points, etc. Knowing where these congestion points are located is very useful for the trader, and can be used as a basis for different strategies.
This tool assigns a certain amount of “weight” to each indicator, and this “weight” can influence adjacents price levels. This means that one price level without any indicator or moving average but under the influence of two “strongly weighted” levels accumulate more resistance than their neighbors. In these cases, the tool signals resistance in apparently empty areas.
Information on these pages contains forward-looking statements that involve risks and uncertainties. Markets and instruments profiled on this page are for informational purposes only and should not in any way come across as a recommendation to buy or sell in these assets. You should do your own thorough research before making any investment decisions. FXStreet does not in any way guarantee that this information is free from mistakes, errors, or material misstatements. It also does not guarantee that this information is of a timely nature. Investing in Open Markets involves a great deal of risk, including the loss of all or a portion of your investment, as well as emotional distress. All risks, losses and costs associated with investing, including total loss of principal, are your responsibility. The views and opinions expressed in this article are those of the authors and do not necessarily reflect the official policy or position of FXStreet nor its advertisers. The author will not be held responsible for information that is found at the end of links posted on this page.
If not otherwise explicitly mentioned in the body of the article, at the time of writing, the author has no position in any stock mentioned in this article and no business relationship with any company mentioned. The author has not received compensation for writing this article, other than from FXStreet.
FXStreet and the author do not provide personalized recommendations. The author makes no representations as to the accuracy, completeness, or suitability of this information. FXStreet and the author will not be liable for any errors, omissions or any losses, injuries or damages arising from this information and its display or use. Errors and omissions excepted.
The author and FXStreet are not registered investment advisors and nothing in this article is intended to be investment advice.
Recommended Content
Editors’ Picks

AUD/USD remains depressed below 0.6300 as trade jitters underpin USD
AUD/USD trades with a negative bias below the 0.6300 mark amid a mildly stronger USD, which hit a three-week top during the Asian session. Moreover, worries over Trump's trade tariffs weigh on investors' sentiment and further undermine the risk-sensitive Aussie amid bets that the RBA will cut interest rates again in May.

USD/JPY flat-lined around mid-150.00s; remains close to multi-week high set on Tuesday
USD/JPY struggles to build on the overnight move higher and oscillates around mid-150.00s during the Asian session on Thursday amid mixed cues. Hawkish BoJ expectations and the risk-off impulse, led by Trump's new tariff on imported cars, underpin the safe-haven JPY, capping spot prices.

Gold price sticks to positive bias above $3,000 on safe-haven demand
Gold price ticks higher during the Asian session on Thursday as worries about Trump's tariff plans continue to benefit the safe-haven bullion. However, a modest USD uptick to a three-week high caps the commodity. Traders also seem reluctant and opt to wait for the release of the US PCE Price Index on Friday.

Stablecoin mania kicks off as Wyoming and Fidelity join the race
According to Governor Mark Gordon, the state of Wyoming has joined the race for a stablecoin, following plans to launch WYST, a US Dollar-backed token in July.

Sticky UK services inflation shows signs of tax hike impact
There are tentative signs that the forthcoming rise in employer National Insurance is having an impact on service sector inflation, which came in a tad higher than expected in February. It should still fall back in the second quarter, though, keeping the Bank of England on track for three further rate cuts this year.

The Best brokers to trade EUR/USD
SPONSORED Discover the top brokers for trading EUR/USD in 2025. Our list features brokers with competitive spreads, fast execution, and powerful platforms. Whether you're a beginner or an expert, find the right partner to navigate the dynamic Forex market.