GBP/USD technical bearish trend continuation

GBP/USD technical analysis
-
GBP/USD is in downtrend.
-
The pattern is a bearish continuation sign.
-
Q L3 should be the target.
-
Bearish Zig-zag.
D1 chart GBP/USD
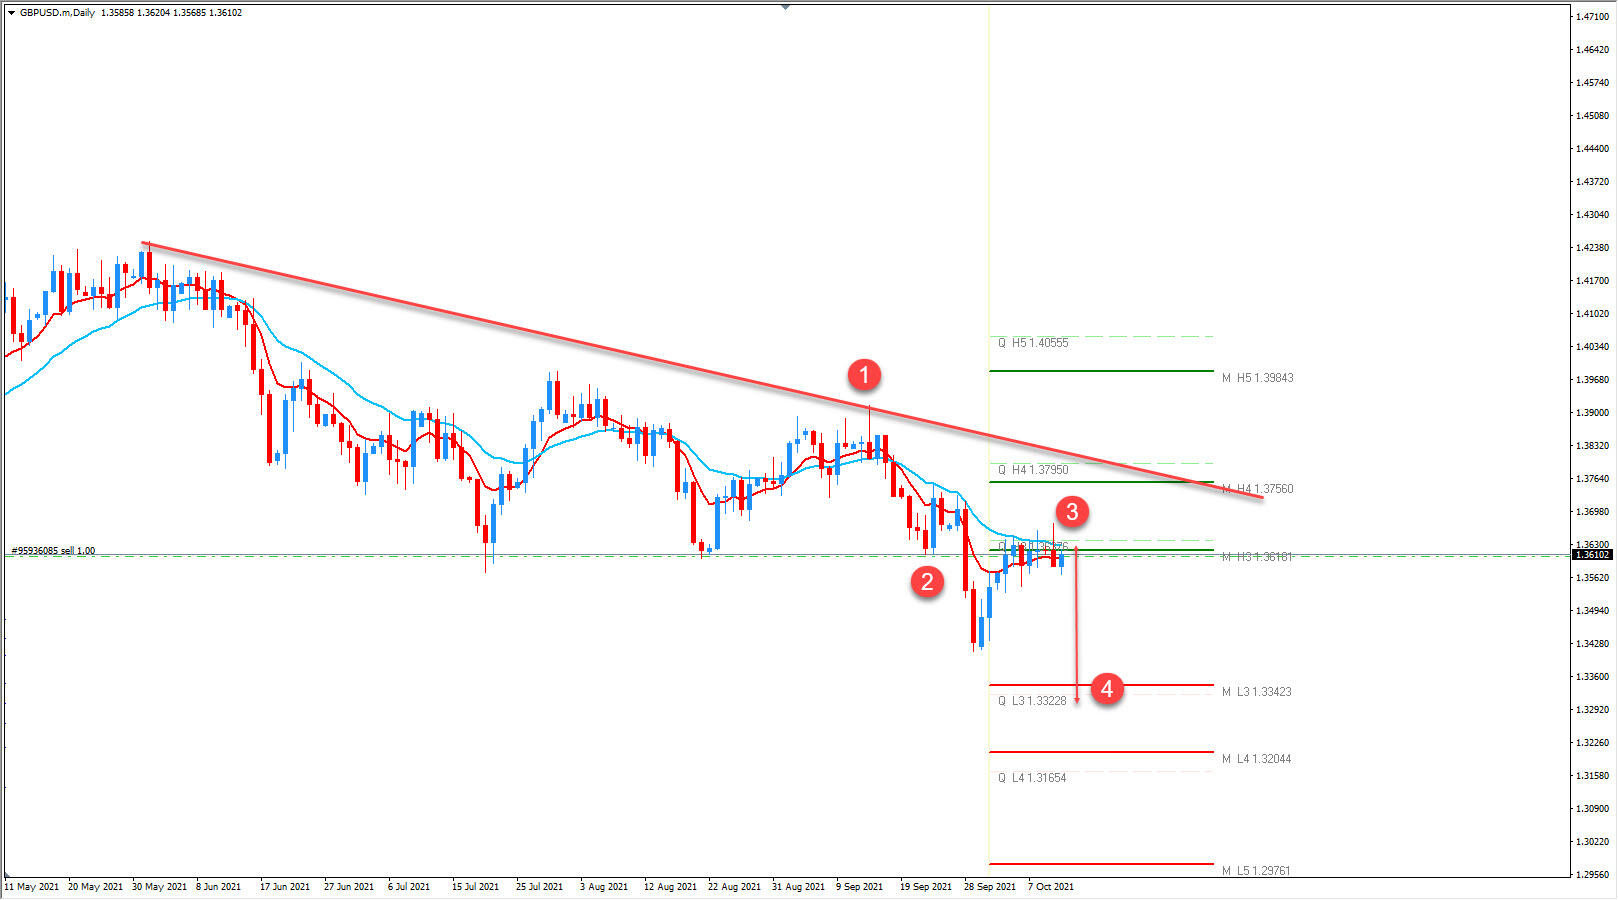
1. Descending Trendline.
2. Bearish Order block.
3. Pinbar Bearish.
4. Q L3 and M L3 Pivot targets.
The price is currently bearish and supported around 1,3600. We can see lots of selling pressure from the M H3 resistance. Candlesticks are bearish and imply a possible breakout and continuation move down. The trend line acts as a resistance and it's keeping bulls from advancing. If the break of the trendline happens the market will go higher. The move higher would disrupt the overall scenario of bearish GBP/USD. We should see a move down towards 1.3550 followed by 1.3500. The final target is 1.3340 but only as a part of a stronger swing and move down.
The analysis has been done with the CAMMACD.Core System.
For more daily technical and wave analysis and updates, sign-up up to our ecs.LIVE channel.
Author

Nenad Kerkez
Top-XE


