|

GBP/USD may correct lower after the surge above 1.3000 — Confluence Detector

The GBP/USD soared on the optimism in Brexit talks after a long standstill. The pair topped 1.3000. What's next? Resistance lines look more substantial than support ones.

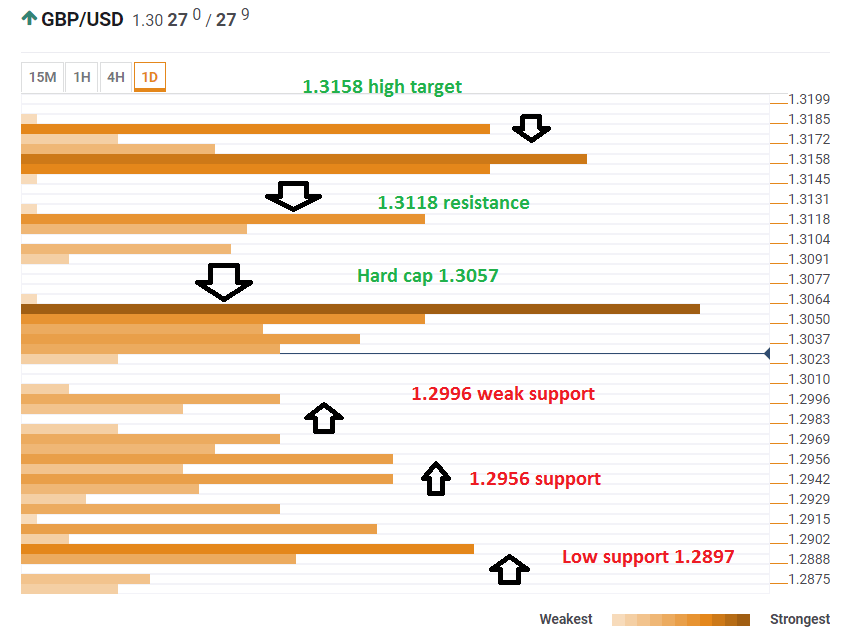
The Technical Confluences Indicator shows that a considerable cap awaits at 1.3057, where we see the convergence of the Bolinger Band one-day Upper, the Fibonacci 23.6% on-month, and the Simple Moving Average 50 one-day.

Next up we find 1.3118 which is the confluence of the potent Fibonacci 38.2% one-month and the Bolinger Band one-hour Upper, 

1.3158 looms far above. It is the meeting point of two Pivot Points: the one-week Resistance 3 and the Pivot Point one-day Resistance 2.

On the downside, we see some support at 1.2996 which is the confluence of the Fibonacci 23.6% one-day and the SMA 5-4h.

1.2956 is the next cushion. It is the convergence of the PP one-week R1 and the SMA 200-4h. 

There are quite a few other support levels on the downside, but the most significant congestion of lines is at 1.2897 where we see the SMA 100-1h, the SMA 5-one-day, and the Fibonacci 23.6% one-week.

This is how it looks on the tool:

GBP USD confluence levels August 30 2018

Confluence Detector

The Confluence Detector finds exciting opportunities using Technical Confluences. The TC is a tool to locate and point out those price levels where there is a congestion of indicators, moving averages, Fibonacci levels, Pivot Points, etc. Knowing where these congestion points are located is very useful for the trader, and can be used as a basis for different strategies.

This tool assigns a certain amount of “weight” to each indicator, and this “weight” can influence adjacents price levels. This means that one price level without any indicator or moving average but under the influence of two “strongly weighted” levels accumulate more resistance than their neighbors. In these cases, the tool signals resistance in apparently empty areas.

Learn more about Technical Confluence

Author

Yohay Elam

Yohay Elam

FXStreet

Yohay is in Forex since 2008 when he founded Forex Crunch, a blog crafted in his free time that turned into a fully-fledged currency website later sold to Finixio.

More from Yohay Elam
Share:

Editor's Picks

EUR/USD struggles near 1.1850, with all eyes on US CPI data

EUR/USD holds losses while keeping its range near 1.1850 in European trading on Friday. A broadly cautious market environment paired with a steady US Dollar undermines the pair ahead of the critical US CPI data. Meanwhile, the Eurozone Q4 GDP second estimate has little to no impact on the Euro. 

GBP/USD recovers above 1.3600, awaits US CPI for fresh impetus

GBP/USD recovers some ground above 1.3600 in the European session on Friday, though it lacks bullish conviction. The US Dollar remains supported amid a softer risk tone and ahead of the US consumer inflation figures due later in the NA session on Friday. 

Gold remains below $5,000 as US inflation report looms

Gold retreats from the vicinity of the $5,000 psychological mark, though sticks to its modest intraday gains in the European session. Traders now look forward to the release of the US consumer inflation figures for more cues about the Fed policy path. The outlook will play a key role in influencing the near-term US Dollar price dynamics and provide some meaningful impetus to the non-yielding bullion.

US CPI data set to show modest inflation cooling as markets price in a more hawkish Fed

The US Bureau of Labor Statistics will publish January’s Consumer Price Index data on Friday, delayed by the brief and partial United States government shutdown. The report is expected to show that inflationary pressures eased modestly but also remained above the Federal Reserve’s 2% target.

The weekender: When software turns the blade on itself

Autonomous AI does not just threaten trucking companies and call centers. It challenges the cognitive toll booths that legacy software has charged for decades. This is not a forecast. No one truly knows the end state of AI.

Solana Price Forecast: Mixed market sentiment caps recovery

Solana (SOL) is trading at $79 as of Friday, following a correction of over 9% so far this week. On-chain and derivatives data indicates mixed sentiment among traders, further limiting the chances of a price recovery.