|

GBP/USD is locked in a clear range as a second referendum gains traction — Confluence Detector

GBP/USD is trading marginally lower amid news that the UK Labour Party tabled a parliamentary motion that could open the door to a second EU Referendum, potentially averting Brexit. 

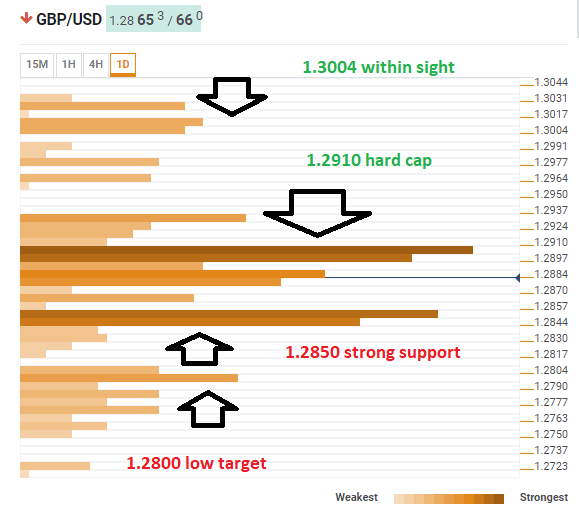
The Technical Confluences Indicator shows that cable faces resistance at 1.2910 which is the convergence of the Pivot Point one-month Resistance 1, the Bollinger Band 4h-Middle, the Simple Moving Average 5-one-day, the SMA 200-15m, the SMA 100-one-day, the Fibonacci 23.6% one-day, and more.

Breaking above this level will allow GBP/USD to run higher, opening the road to 1.3004 where we see the Pivot Point one-day R3, and last week's high.

Looking down, Sterling has significant support at 1.2850 where we see the confluence of the Pivot Point one-day Support 1, the SMA 10-one-day, last month's high and also the SMA 200-1h, and the Fibonacci 61.8% one-day.

Losing that line could send the pair down to 1.2800 where we see the convergence of the Fibonacci 61.8% one-week, the SMA 100-4h, and the Pivot Point one-day S2.

All in all, once GBP/USD decides where to break out to, it could run quite a bit.

This is how it looks on the tool:

GBP USD technical confluence January 22 2019

Confluence Detector

The Confluence Detector finds exciting opportunities using Technical Confluences. The TC is a tool to locate and point out those price levels where there is a congestion of indicators, moving averages, Fibonacci levels, Pivot Points, etc. Knowing where these congestion points are located is very useful for the trader, and can be used as a basis for different strategies.

This tool assigns a certain amount of “weight” to each indicator, and this “weight” can influence adjacents price levels. This means that one price level without any indicator or moving average but under the influence of two “strongly weighted” levels accumulate more resistance than their neighbors. In these cases, the tool signals resistance in apparently empty areas.

Learn more about Technical Confluence

Author

Yohay Elam

Yohay Elam

FXStreet

Yohay is in Forex since 2008 when he founded Forex Crunch, a blog crafted in his free time that turned into a fully-fledged currency website later sold to Finixio.

More from Yohay Elam
Share:

Editor's Picks

AUD/USD falls to near 0.7100 after slipping below 50-day EMA

AUD/USD depreciates after registering minor gains in the previous day, trading around 0.7120 during the Asian hours. The technical analysis of the daily chart shows the pair consolidating sideways within a rectangle pattern, as neither bulls nor bears gain control. The AUD/USD pair is holding a slight bearish tone however as it sits beneath both the nine-day and 50-day EMAs.

160.00: USD/JPY back near intervention territory after upbeat US jobs report

US Nonfarm Payrolls beat expectations by a wide margin in May, with 172K jobs added. The US Dollar rebounds after the release, helping USD/JPY recover from its intraday lows. Warnings from Japanese authorities continue to limit upside potential near the 160.00 threshold.

Gold targets $4,300 amid stronger Dollar

Gold faces increasing selling interest and navigates the area of three-month lows near the $4,300 mark per troy ounce on Friday. The precious metal’s decline comes as traders assess the stronger-than-expected NFP, while the bid bias in the Greenback and higher US Treasury yields also collaborate with the retracement.

Cardano hits five-year low even as Hoskinson clarifies "break" isn't an exit

Cardano (ADA) price is down 10% at press time on Friday, extending losses over 30% so far this week amid Charles Hoskinson's clarification that "break" isn't an exit.

Week ahead – Fed countdown begins amid US inflation data and geopolitical risks

Fed Chair Warsh’s first meeting approaches as key US inflation data could reshape expectations. Oil prices remain elevated as US-Iran talks continue; tariffs also return to the spotlight. ECB is expected to hike; will it be a one-off move or is July live?

The US economy defies the rules: 100 days into the Oil shock and the recession signal is still missing

More than three months after the start of the Iran war and the resulting disruption to global energy markets, the US economy continues to display remarkable resilience. The conflict has triggered a sharp rise in Oil prices, reignited inflationary pressures and fueled widespread concerns about a potential economic slowdown.