|

GBP/USD has resumed its upward move [Video]

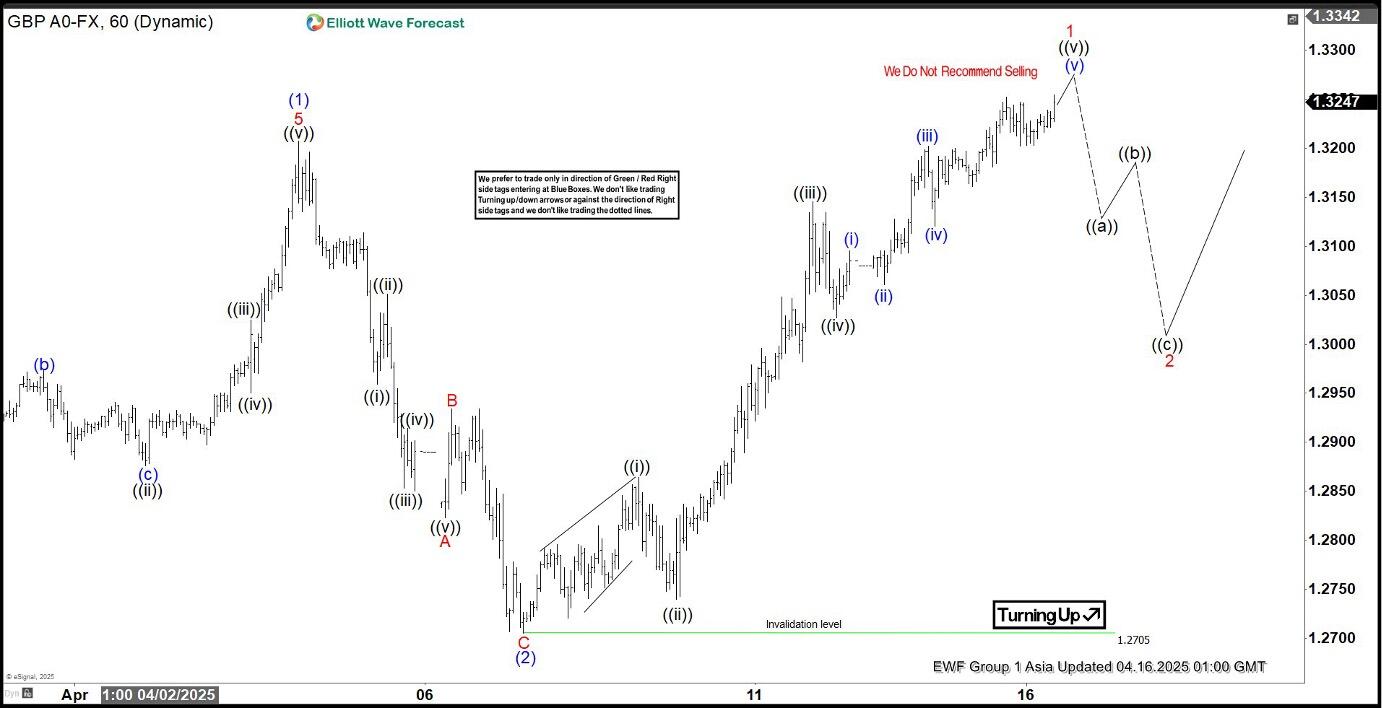
GBP/USD has recently broken above its April 3, 2025 peak of 1.3207, which we identified as wave (1) in the chart. This breakout signals a bullish trend starting from the January 13, 2025 low of 1.2705, suggesting more upward movement ahead. The rally from this low follows a five-wave Elliott Wave pattern. This is a common structure in technical analysis indicating a strong trend.

Starting from the January 13 low, the first wave or wave (1) reached 1.3207.,A pullback in wave (2) then followed which ended at 1.2705. This pullback formed a zigzag pattern. Wave A dropped to 1.2823, wave B rose to 1.2934, and wave C fell to 1.2705, completing wave (2).

The pair has now moved higher into wave (3). From the wave (2) low, the first sub-wave (wave ((i))) peaked at 1.2864, followed by a dip in wave ((ii)) to 1.274. The third sub-wave (wave ((iii))) climbed to 1.314, and the fourth (wave ((iv))) dipped to 1.3027. The fifth sub-wave (wave ((v))) is expected to finish soon, completing wave 1 of a larger pattern.

After this, the pair is likely to pull back in wave 2, correcting the upward move from the April 8, 2025 low. This correction could unfold in 3, 7, or 11 smaller swings before the pair resumes its upward trend. In the short term, as long as the 1.27 low holds, any dips should attract buyers in 3, 7, or 11 swings, supporting further gains.

GBP/USD 60 minute Elliott Wave chart

GBP/USD Elliott Wave [Video]

Youtube preview

Author

Elliott Wave Forecast Team

Elliott Wave Forecast Team

ElliottWave-Forecast.com

More from Elliott Wave Forecast Team
Share:

Editor's Picks

EUR/USD trims gains, hovers around 1.1900 post-US data

EUR/USD trades slightly on the back foot around the 1.1900 region in a context dominated by the resurgence of some buying interest around the US Dollar on turnaround Tuesday. Looking at the US docket, Retail Sales disappointed expectations in December, while the ADP 4-Week Average came in at 6.5K.

GBP/USD comes under pressure near 1.3680

The better tone in the Greenback hurts the risk-linked complex on Tuesday, prompting GBP/USD to set aside two consecutive days of gains and trade slightly on the defensive below the 1.3700 mark. Investors, in the meantime, keep their attention on key UK data due later in the week.

Gold loses some traction, still above $5,000

Gold faces some selling pressure on Tuesday, surrendering part of its recent two-day advance although managing to keep the trade above the $5,000 mark per troy ounce. The daily pullback in the precious metal comes in response to the modest rebound in the US Dollar, while declining US Treasury yields across the curve seem to limit the downside.

XRP holds $1.40 amid ETF inflows and stable derivatives market

Ripple trades under pressure, with immediate support at $1.40 holding at the time of writing on Tuesday. A recovery attempt from last week’s sell-off to $1.12 stalled at $1.54 on Friday, leading to limited price action between the current support and the resistance.

Dollar drops and stocks rally:  The week of reckoning for US economic data

Following a sizeable move lower in US technology Stocks last week, we have witnessed a meaningful recovery unfold. The USD Index is in a concerning position; the monthly price continues to hold the south channel support.

XRP holds $1.40 amid ETF inflows and stable derivatives market

Ripple trades under pressure, with immediate support at $1.40 holding at the time of writing on Tuesday. A recovery attempt from last week’s sell-off to $1.12 stalled at $1.54 on Friday, leading to limited price action between the current support and the resistance.