GBP/USD Forecast: Will 1.3000 support continue to hold?
- GBP/USD has edged lower toward 1.3000 at the beginning of the week.
- The greenback preserves its strength despite improving market mood.
- GBP/USD could come under heavy bearish pressure should 1.3000 support fail.

After having started the week with a small bullish gap, GBP/USD has lost its traction and touched its weakest level since November 2020 at 1.3008 during the Asian trading hours on Monday. The pair is trading near Friday's closing level of 1.3030 in the early European session as investors remain hopeful for a de-escalation of the Russia-Ukraine conflict.
Reflecting the upbeat market mood, US stock index futures are rising between 0.7% and 0.9%. Despite the risk-positive atmosphere, the greenback is holding its ground on Monday and not allowing GBP/USD to gather bullish momentum. With the benchmark 10-year US Treasury bond yield rising 2% on the day at 2.04%, the US Dollar Index is moving sideways above 99.00.
According to RIA news agency, Russian delegate Leonid Slutsky noted over the weekend that the latest talks with Ukraine made substantial progress. "This progress may grow in the coming days into a joint position of both delegations, into documents for signing," Slutsky added. On a similar sentiment, Ukrainian negotiator and presidential adviser Mykhailo Podolyak tweeted out that Russia was carefully listening to Ukraine's proposals and that there was dialogue.
Officials from Ukraine and Russia will reportedly hold a video conference at 0830 GMT on Monday. In case markets continue to price in a diplomatic solution conflict to the conflict, GBP/USD is likely to capitalize on a relief rally. On the flip side, a negative shift in risk sentiment could provide a boost to the dollar and weigh on the pair.
There won't be any high-tier macroeconomic data releases from the US on Monday.
GBP/USD Technical Analysis
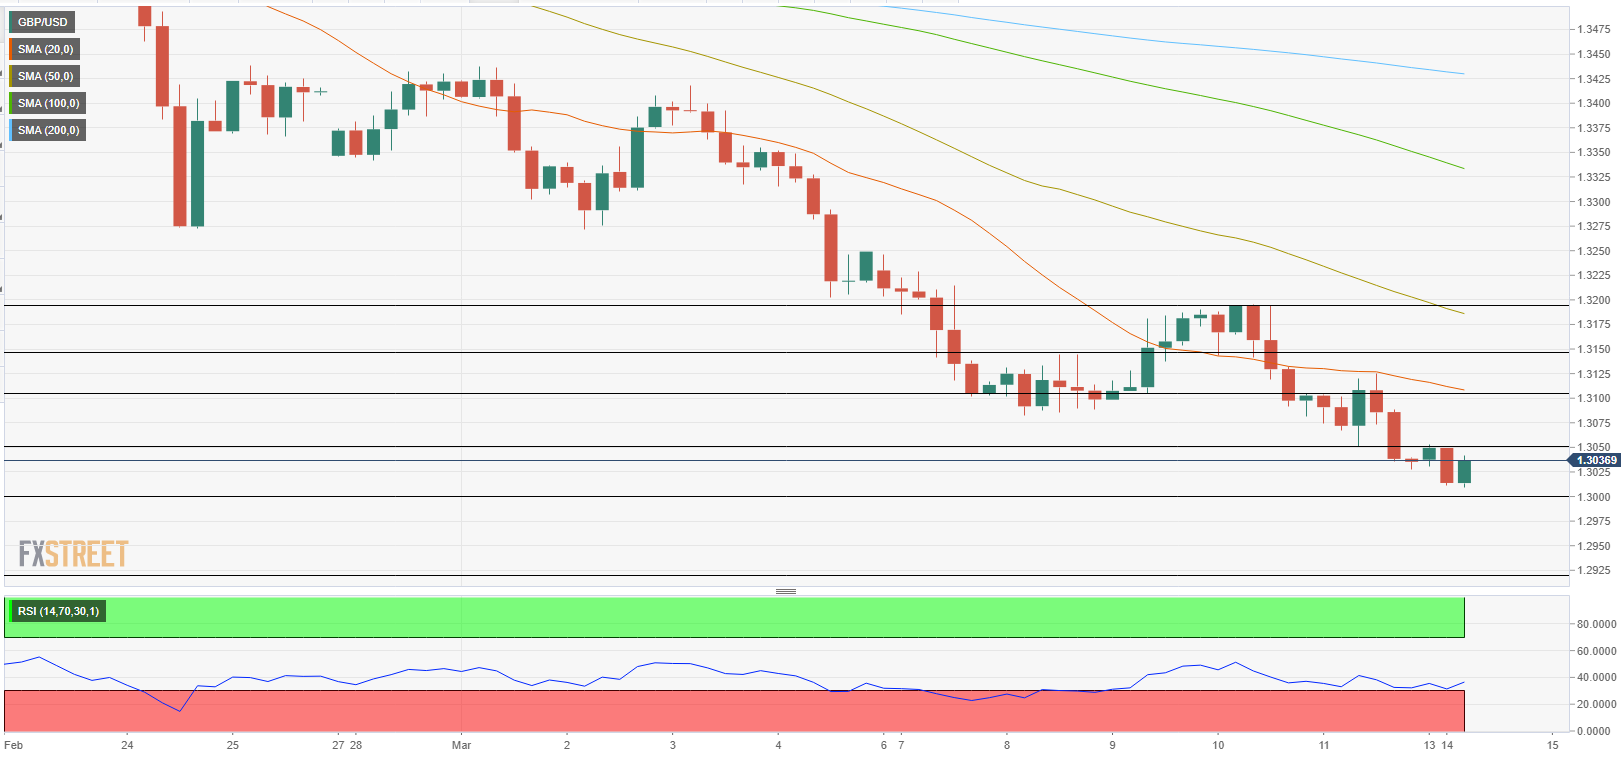
GBP/USD faces interim resistance at 1.3050 (static level). In case a four-hour candle closes above that level, the pair could extend its recovery toward 1.3100 (20-period SMA on the four-hour chart, static level) and 1.3150 (static level).
On the downside, 1.3000 (psychological level) aligns as critical support. If that level turns into resistance, 1.2920 (static level) could be seen as the next bearish target.
In the meantime, the Relative Strength Index (RSI) indicator on the four-hour chart is still below 50, suggesting that the pair is still in a corrective phase.
Premium
You have reached your limit of 3 free articles for this month.
Start your subscription and get access to all our original articles.
Author

Eren Sengezer
FXStreet
As an economist at heart, Eren Sengezer specializes in the assessment of the short-term and long-term impacts of macroeconomic data, central bank policies and political developments on financial assets.


