GBP/USD Forecast: Sellers wait for 1.3600 support to fail
- GBP/USD has gone into a consolidation phase after testing 1.3600.
- The pair stays inversely correlated with the 10-year US T-bond yield.
- Near-term resistance seems to have formed at 1.3650.
GBP/USD has managed to stage a technical correction after pushing lower earlier in the week and seems to have gone into a consolidation phase above 1.3600. The near-term technical outlook doesn't yet point to a buildup of bullish momentum and the pair could come under renewed selling pressure if buyers fail to defend 1.3600.
The British pound struggled to capitalize on the hot inflation data from the UK on Wednesday but gained traction ahead of the American session as retreating US Treasury bond yields caused the greenback to lose interest. This action confirms the view that the dollar's valuation remains the primary driver of the pair.
The benchmark 10-year US T-bond yield is down 1% early Thursday, forcing the US Dollar Index to stay under bearish pressure near 95.50 and allowing GBP/USD to cling to modest daily gains.
In the second half of the day, the US Department of Labor's weekly Initial Jobless Claims data and the Federal Reserve Bank of Philadelphia's Manufacturing Survey will be featured in the US economic docket. The S&P 500 Futures, which was up more than 0.5% earlier in the day, was last seen rising 0.3% on the day. In case Wall Street's main indexes continue to push lower after the opening bell, we could see the dollar regather its strength. On the other hand, GBP/USD could benefit from the risk-positive market environment if US stocks rebound in a convincing way.
GBP/USD Technical Analysis
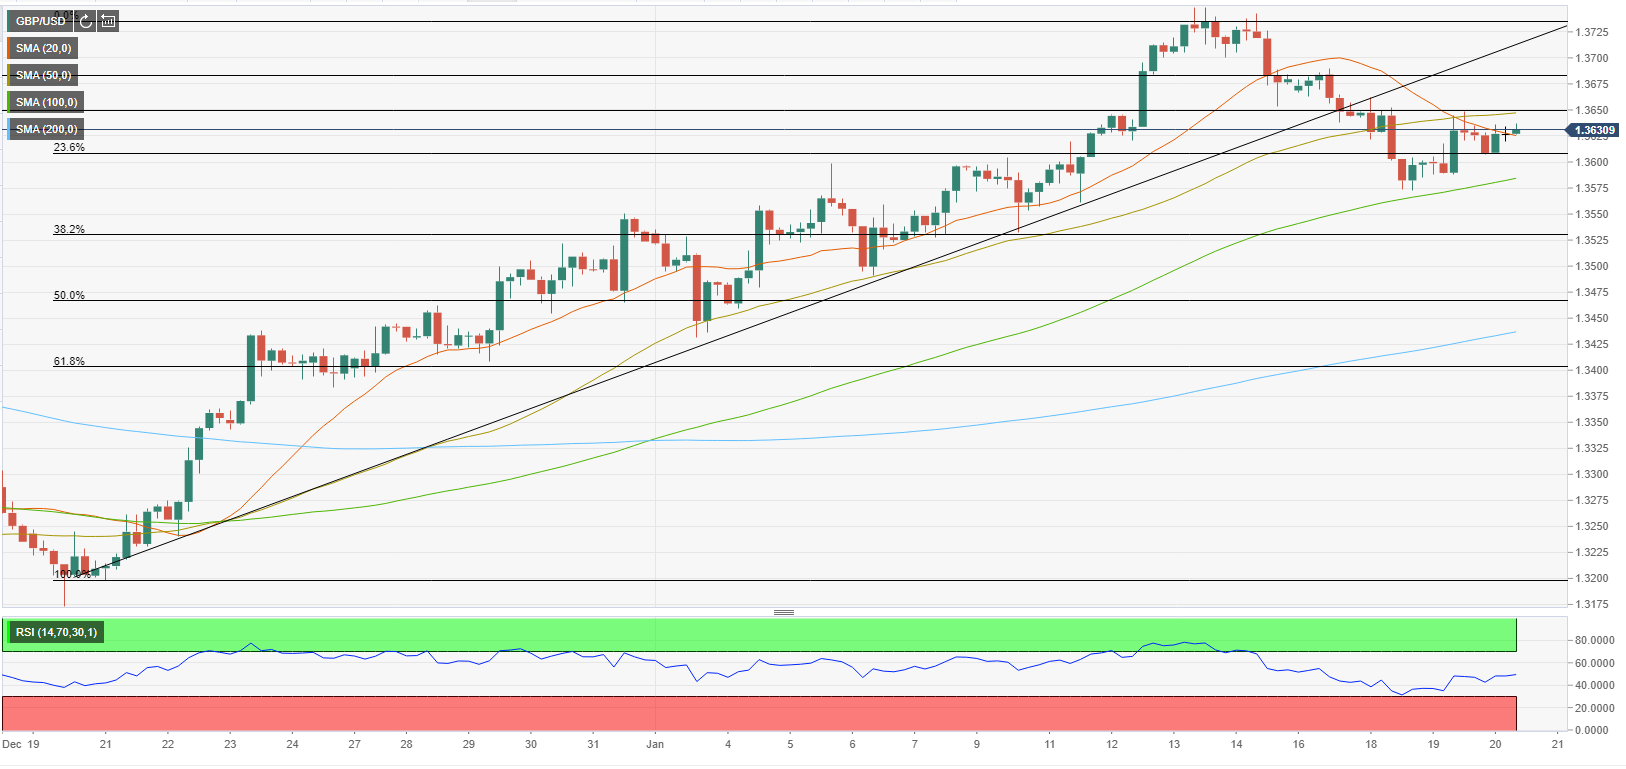
Interim resistance for GBP/USD seems to have formed at 1.3650, where the 50-period SMA on the four-hour chart is located. The pair needs to rise above that level and start using it as support to attract bulls. 1.3680 (static level) and 1.3700 (psychological level, broken ascending trendline coming from December) align as the next hurdles.
On the downside, the 100-period SMA forms dynamic support a little below 1.3600. Fibonacci 23.6% retracement level of the one-month uptrend is also reinforcing that level. If we see a four-hour candle close below that support, the next bearish target could be seen at 1.3530 (Fibonacci 38.2% retracement).
Premium
You have reached your limit of 3 free articles for this month.
Start your subscription and get access to all our original articles.
Author

Eren Sengezer
FXStreet
As an economist at heart, Eren Sengezer specializes in the assessment of the short-term and long-term impacts of macroeconomic data, central bank policies and political developments on financial assets.


