GBP/USD Forecast: Risky to bet on a steady Pound Sterling recovery
- GBP/USD slumped to a new multi-month low below 1.2150.
- Investors continue to ignore the pair's oversold conditions.
- A risk rally could limit the USD's gains and help the pair find support.

GBP/USD broke through 1.2200 on Tuesday and extended its slide to a fresh six-month low below 1.2150. The near-term technical picture shows that the pair remains oversold. Investors, however, could opt to wait for a steady improvement in risk mood before positioning themselves for a convincing recovery in the pair.
Wall Street's main indexes lost more than 1% on Tuesday amid growing fears over a US government shutdown. Although US stock index futures trade modestly higher, participants could refrain from betting on a risk rally unless Republicans and Democrats agree on a bipartisan spending bill ahead of Sunday's deadline.
Pound Sterling price this week
The table below shows the percentage change of Pound Sterling (GBP) against listed major currencies this week. Pound Sterling was the weakest against the US Dollar.
| USD | EUR | GBP | CAD | AUD | JPY | NZD | CHF | |
| USD | 0.83% | 0.74% | 0.40% | 1.01% | 0.52% | 0.40% | 1.01% | |
| EUR | -0.83% | -0.08% | -0.42% | 0.20% | -0.32% | -0.44% | 0.18% | |
| GBP | -0.77% | 0.08% | -0.35% | 0.28% | -0.23% | -0.36% | 0.26% | |
| CAD | -0.42% | 0.42% | 0.34% | 0.64% | 0.11% | -0.02% | 0.60% | |
| AUD | -1.04% | -0.21% | -0.30% | -0.64% | -0.53% | -0.66% | -0.03% | |
| JPY | -0.52% | 0.33% | 0.24% | -0.11% | 0.52% | -0.12% | 0.50% | |
| NZD | -0.41% | 0.43% | 0.35% | 0.02% | 0.63% | 0.11% | 0.62% | |
| CHF | -1.03% | -0.19% | -0.27% | -0.61% | 0.02% | -0.50% | -0.63% |
The heat map shows percentage changes of major currencies against each other. The base currency is picked from the left column, while the quote currency is picked from the top row. For example, if you pick the Euro from the left column and move along the horizontal line to the Japanese Yen, the percentage change displayed in the box will represent EUR (base)/JPY (quote).
Later in the day, the US Census Bureau will release Durable Goods Orders data for August. Markets expect a 0.5% decrease following the 5.2% contraction recorded in July. If there is another big decline in this data, the initial reaction could hurt the USD.
The US Department of Treasury will hold a 5-year US Treasury note auction in the American session on Thursday. In case there is a strong demand for bonds and a noticeable decline in the high-yield outcome, the USD could lose its strength. Nonetheless, investors are likely to stay focused on political developments in the US.
GBP/USD Technical Analysis
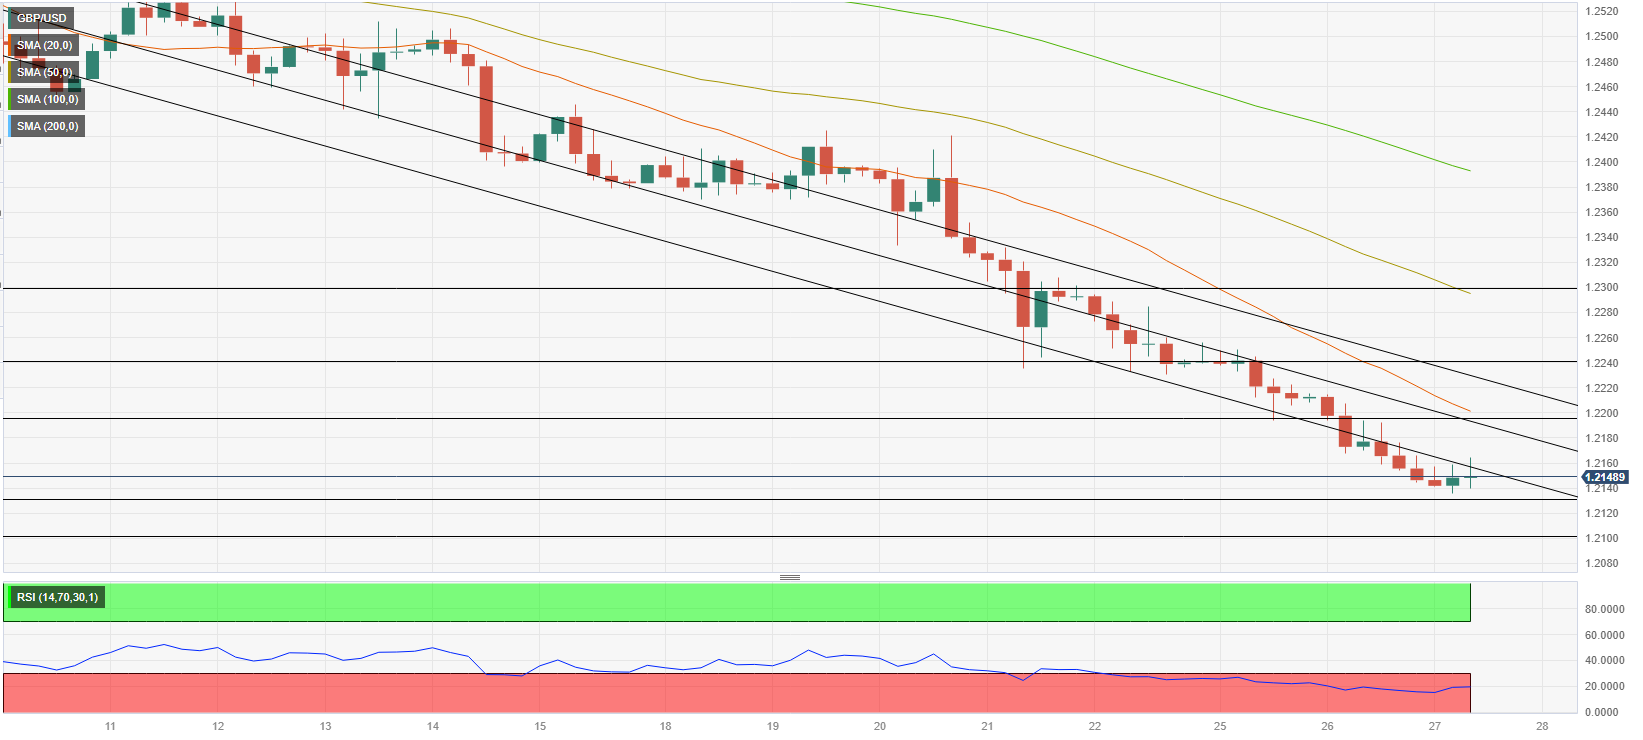
The Relative Strength Index (RSI) indicator on the 4-hour chart stays well below 30 and GBP/USD trades slightly below the lower limit of the descending regression channel, reaffirming oversold conditions. If the pair stages a technical correction, it could face resistance at 1.2200 (20-period Simple Moving Average (SMA), mid-point of the descending regression channel), 1.2240 (upper limit of the descending channel) and 1.2300 (psychological level, 50-period SMA).
On the downside, 1.2130 (static level from February) aligns as immediate support before 1.2100 (psychological level, static level) and 1.2050 (static level).
Premium
You have reached your limit of 3 free articles for this month.
Start your subscription and get access to all our original articles.
Author

Eren Sengezer
FXStreet
As an economist at heart, Eren Sengezer specializes in the assessment of the short-term and long-term impacts of macroeconomic data, central bank policies and political developments on financial assets.


