GBP/USD Forecast: Pound tests key 1.3500 support, pressured by risk aversion
- GBP/USD has declined toward 1.3500 pressured by risk aversion.
- UK's FTSE 100 Index is losing more than 2% to start the week.
- Dollar is likely to preserve its strength unless the market mood improves.
GBP/USD has faced renewed bearish pressure after closing the previous week in positive territory with safe-haven flows dominating the financial markets. The pair was last seen testing 1.3500 and the bearish pressure could ramp up in case that level turns into resistance.
Reports claiming that Russia could invade Ukraine this week are causing investors to seek refuge at the beginning of the week. In turn, the UK's FTSE 100 Index is down 2.2% in the early European session and US stocks futures are falling between 0.9% and 1.4%.
More importantly, the greenback is outperforming its risk-sensitive rivals with the US Dollar Index climbing to its highest level in more than 10 days near 96.30.
Later in the session, St Louis Fed President James Bullard will appear in an interview with CNBC. Last week, Bullard argued that the Fed would need to hike its policy rate by 100 basis points by July to battle inflation. Unless Bulard makes a U-turn and adopts a dovish tone, market participants are likely to ignore his comments and remain focused on the risk perception.
On Tuesday, the UK's Office for National Statistics will release the labour market report. Markets expect the annual wage inflation in three months to December, as measured by the Average Earnings Including Bonus, to decline to 3.9% from 4.2%. A stronger-than-expected print could help the British pound find demand and vice versa.
GBP/USD Technical Analysis
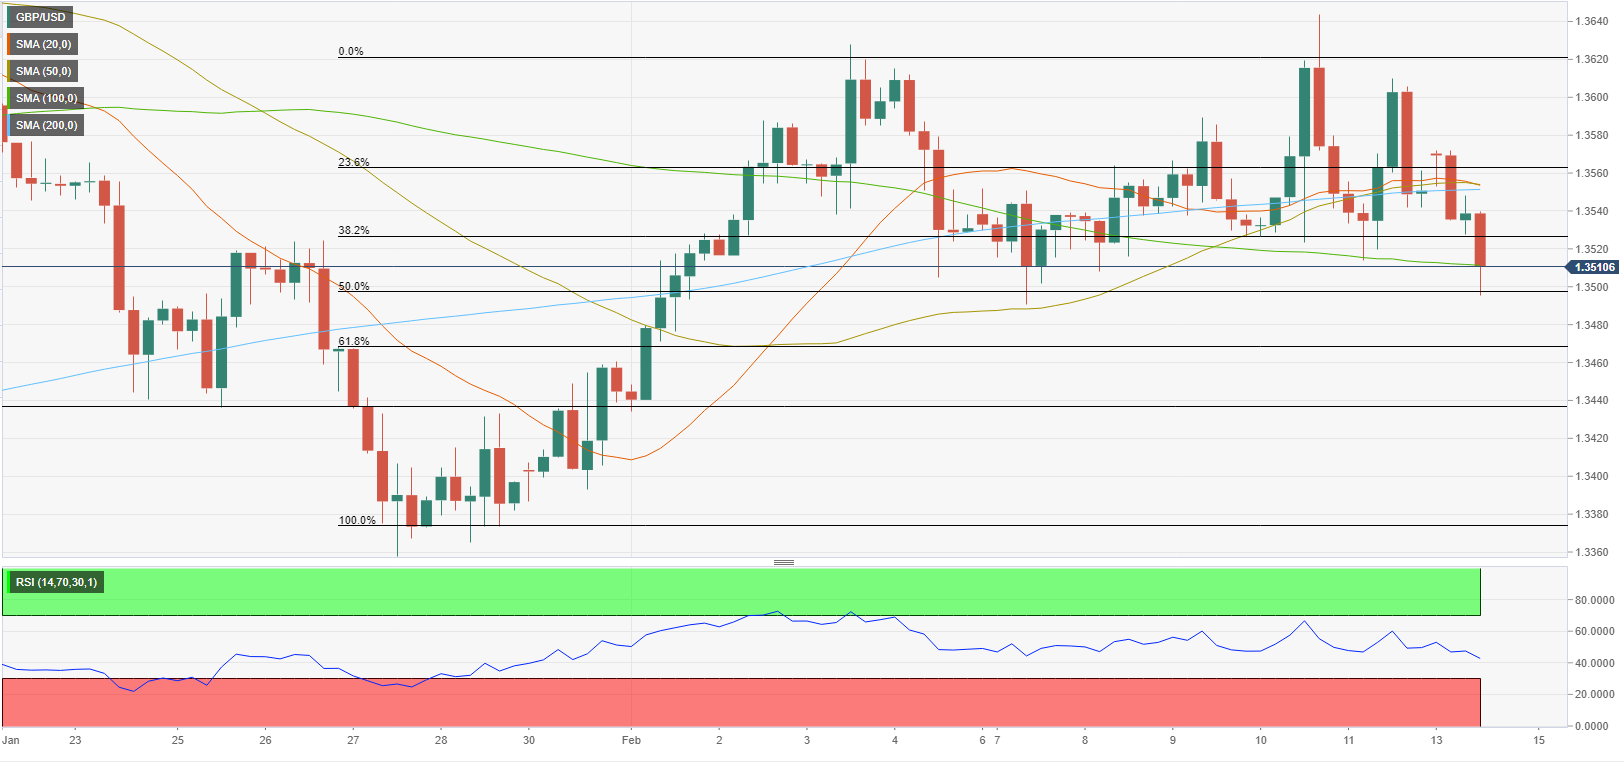
1.3500 (psychological level, Fibonacci 50% retracement of the latest uptrend) aligns as critical support. If a four-hour candle closes below that level and uses it as resistance, the next bearish target is located at 1.3470 (Fibonacci 61.8% retracement) ahead of 1.3440 (static level).
On the upside, 1.3520 (Fibonacci 38.2% retracement) forms the first technical resistance before the 1.3550/1.3560 area (200-period SMA, Fibonacci 23.6% retracement).
Meanwhile, the Relative Strength Index on the four-hour chart is now edging lower toward 40, pointing to a buildup in the selling pressure.
Premium
You have reached your limit of 3 free articles for this month.
Start your subscription and get access to all our original articles.
Author

Eren Sengezer
FXStreet
As an economist at heart, Eren Sengezer specializes in the assessment of the short-term and long-term impacts of macroeconomic data, central bank policies and political developments on financial assets.


