GBP/USD Forecast: Pound Sterling struggles to clear key 1.2750 hurdle
- GBP/USD lost its recovery momentum after testing 1.2750.
- Near-term technical outlook suggests that sellers look to retain control of the pair's action.
- Additional losses could be witnessed in case 1.2700 support fails.

GBP/USD tested 1.2750 for the second straight day on Tuesday but failed to clear this level. Although the positive shift seen in risk sentiment could help the pair limit its losses in the near term, technical selling pressure could gain momentum if 1.2700 support fails.
In the Asian session, investors cheered optimistic comments from Chinese Premier Li Qiang, who said China was on track to grow at a stronger pace in the second quarter than in the first. Li also confirmed that the annual growth target was still 5%.
The UK's FTSE 100 Index opened in positive territory on Tuesday but erased its early gains, suggesting that markets remain reluctant to commit to a steady risk rally. Meanwhile, US stock index futures rose between 0.1% and 0.4%. In case Wall Street's main indexes stage a rebound following Monday's sell-off, the USD could have a hard time finding demand in the American session.
The US Census Bureau will release Durable Goods Orders data for May, which is forecast to decline 1% on a monthly basis following April's 1.1% increase. If there is a significant upside surprise, with a monthly increase of 2% or higher, the USD could stay resilient against its rivals.
The Conference Board's Consumer Confidence Index for June and New Home Sales data for May will also be featured in the US economic docket. However, market reaction could remain short-lived ahead of Bank of England Governor Andrew Bailey and Federal Reserve Chairman Jerome Powell's appearance at a panel at the European Central Bank's annual Forum on Central Banking in Sintra on Wednesday.
GBP/USD Technical Analysis
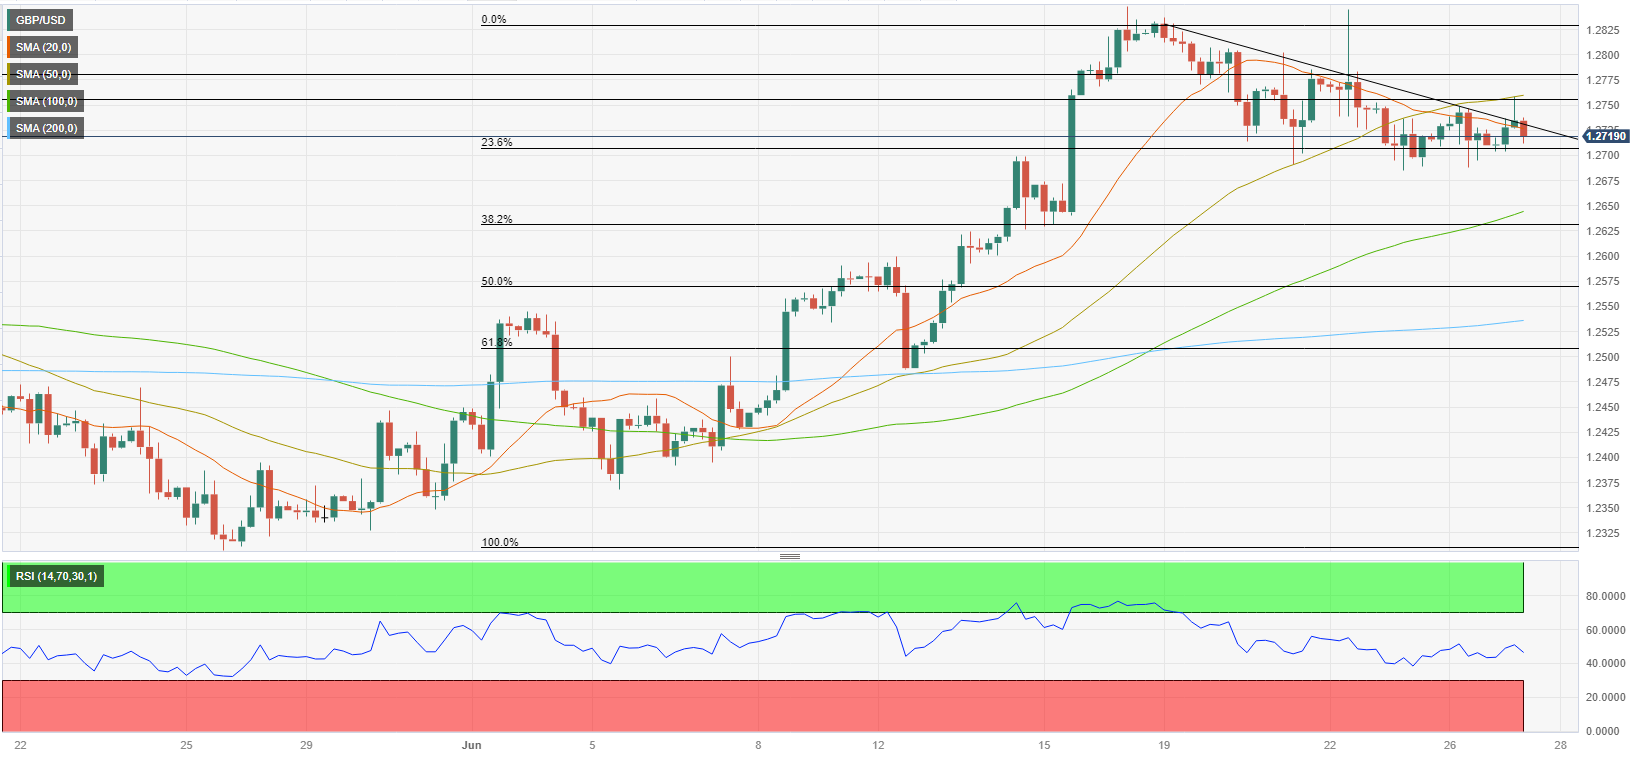
The Relative Strength Index (RSI) indicator on the four-hour chart stays below 50 and GBP/USD continues to trade within a descending triangle, which is generally seen as a bearish continuation pattern.
1.2700 (Fibonacci 23.6% retracement level of the latest uptrend, bottom of the descending triangle) aligns as key support. In case GBP/USD falls below this level and starts using it as support, it could extend its slide toward 1.2650/40 (100-period Simple Moving Average (SMA), Fibonacci 38.2% retracement) and 1.2600 (psychological level).
On the upside, 1.2750 (static level, 50-period SMA) stays intact as resistance. A four-hour close above that level could confirm a bullish shift in the short-term technical outlook. In this scenario, the pair could rebound to 1.2780 (static level) and 1.2800 (psychological level).
Premium
You have reached your limit of 3 free articles for this month.
Start your subscription and get access to all our original articles.
Author

Eren Sengezer
FXStreet
As an economist at heart, Eren Sengezer specializes in the assessment of the short-term and long-term impacts of macroeconomic data, central bank policies and political developments on financial assets.


