GBP/USD Forecast: Pound Sterling isn't out of the woods yet
- GBP/USD has recovered to the 1.2350 area early Friday.
- US PCE inflation data will be watched closely by market participants.
- Near-term technical outlook suggests that the bearish bias persists.

GBP/USD gained traction early Friday, climbing above 1.2350, but the pair's technical outlook is yet to signal a reversal despite the recent rebound. Ahead of the weekend, investors will pay close attention to the Personal Consumption Expenditures (PCE) Price Index data from the US.
Although risk flows returned to markets on Thursday, the US Dollar (USD) preserved its strength as robust US macroeconomic data fed into the hawkish Federal Reserve (Fed) narrative. The US economy's annualized growth rate for the first quarter was upwardly revised to 1.3% from 1.1%, while Initial Jobless Claims for the week ending May 20 came in at 229,000, much lower than the market expectation of 245,000.
Reflecting the shift in market positioning, the CME Group FedWatch Tool's probability of a 25 basis points Fed rate hike in June climbed above 40% from nearly 20%.
In the second half of the day, the US Bureau of Economic Analysis will release the PCE Price Index figures for April. Earlier in the week, Federal Reserve Governor Christopher Waller noted that April PCE inflation data will be critical when deciding on the next policy step.
On a monthly basis, core PCE Price Index is forecast to rise 0.3%. A stronger-than-forecast monthly increase, at or above 0.5%, should provide a boost to the US Dollar and cause GBP/USD to turn south ahead of the weekend. On the flip side, a soft print below 0.3% could cause investors to refrain from betting on one more Fed rate hike, at least in the near term, and trigger a downward correction in the US Dollar Index.
GBP/USD Technical Analysis
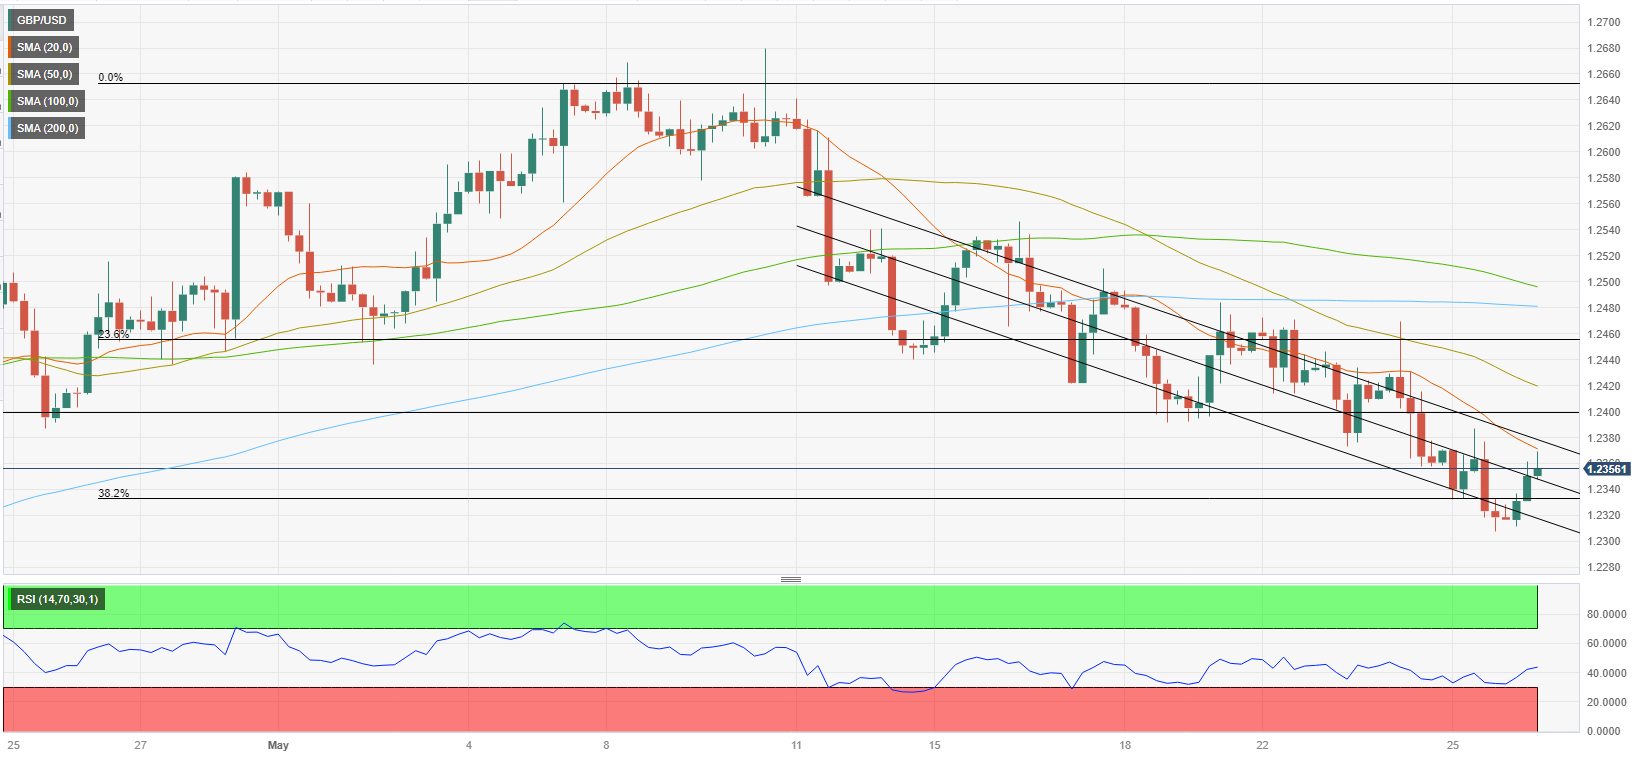
Although GBP/USD closed the last two four-hour candles in the positive territory, it lost its bullish momentum near the 20-period Simple Moving Average (SMA). Additionally, the pair continues to trade within the descending regression channel and the Relative Strength Index (RSI) indicator stays below 50, suggesting that the latest climb was a part of a technical correction rather than the beginning of a bullish move.
If GBP/USD manages to rise above 1.2380 (20-period SMA, upper-limit of the descending channel) and starts using that level as support, it could face interim resistance at 1.2400 (psychological level, static level) and 1.2420 (50-period SMA) before targeting 1.2450 (Fibonacci 23.6% retracement of the latest uptrend).
On the downside, 1.2330 (mid-point of the descending channel) aligns as first support, before 1.2300 (psychological level, static level) and 1.2240 (Fibonacci 50% retracement).
Premium
You have reached your limit of 3 free articles for this month.
Start your subscription and get access to all our original articles.
Author

Eren Sengezer
FXStreet
As an economist at heart, Eren Sengezer specializes in the assessment of the short-term and long-term impacts of macroeconomic data, central bank policies and political developments on financial assets.


