GBP/USD Forecast: Pound Sterling needs a dovish Fed to discourage sellers
- GBP/USD declined toward 1.2500 after disappointing UK data.
- The US Dollar holds its ground following Tuesday's decline.
- The Fed's dot plot could drive the pair's action ahead of the BoE policy announcements.

GBP/USD came under renewed bearish pressure and fell toward 1.2500 in the early European session on Wednesday. Although the pair managed to stabilize above that level, the near-term technical outlook suggests that the bearish bias stays intact.
The UK's Office for National Statistics (ONS) reported on Wednesday that the Gross Domestic Product shrank by 0.3% on a monthly basis in October. This reading followed the 0.2% expansion recorded in September and came in worse than the market expectation for a contraction of 0.1%. Other data from the UK revealed that Industrial Production and Manufacturing Production declined by 0.8% and 1.1% on a monthly basis, respectively.
On top of Tuesday's soft wage inflation readings, these disappointing figures caused Pound Sterling to weaken against its peers. Ahead of the Bank of England's (BoE) policy announcements on Thursday, the rate-sensitive 2-year UK gilt yield turned south and was last seen losing nearly 1.5% on a daily basis.
Pound Sterling price this week
The table below shows the percentage change of Pound Sterling (GBP) against listed major currencies this week. Pound Sterling was the weakest against the Swiss Franc.
| USD | EUR | GBP | CAD | AUD | JPY | NZD | CHF | |
| USD | -0.16% | 0.21% | 0.06% | 0.38% | 0.57% | 0.51% | -0.35% | |
| EUR | 0.16% | 0.37% | 0.22% | 0.55% | 0.72% | 0.67% | -0.19% | |
| GBP | -0.18% | -0.35% | -0.14% | 0.21% | 0.36% | 0.33% | -0.58% | |
| CAD | -0.06% | -0.22% | 0.09% | 0.33% | 0.50% | 0.46% | -0.44% | |
| AUD | -0.40% | -0.56% | -0.25% | -0.32% | 0.17% | 0.14% | -0.78% | |
| JPY | -0.57% | -0.74% | -0.46% | -0.51% | -0.19% | -0.07% | -0.92% | |
| NZD | -0.52% | -0.67% | -0.31% | -0.46% | -0.13% | 0.05% | -0.89% | |
| CHF | 0.36% | 0.20% | 0.54% | 0.41% | 0.75% | 0.91% | 0.86% |
The heat map shows percentage changes of major currencies against each other. The base currency is picked from the left column, while the quote currency is picked from the top row. For example, if you pick the Euro from the left column and move along the horizontal line to the Japanese Yen, the percentage change displayed in the box will represent EUR (base)/JPY (quote).
The Federal Reserve (Fed) is widely expected to leave its policy rate unchanged at 5.25%-5.5% after the last policy meeting of the year. In case the revised Summary of Economic Projections (SEP), commonly known as the dot plot, shows that policymakers see a total rate reduction of 100 basis points or more next year, the USD could come under renewed bearish pressure and help GBP/USD gain traction.
On the other hand, GBP/USD could stay on the back foot if the dot plot or Fed Chairman Jerome Powell's comments go against the market expectation for a rate cut in the first half of the year. According to the CME Group FedWatch Tool, markets are pricing in a slightly less than 50% probability that there will be a policy shift in March.
GBP/USD Technical Analysis
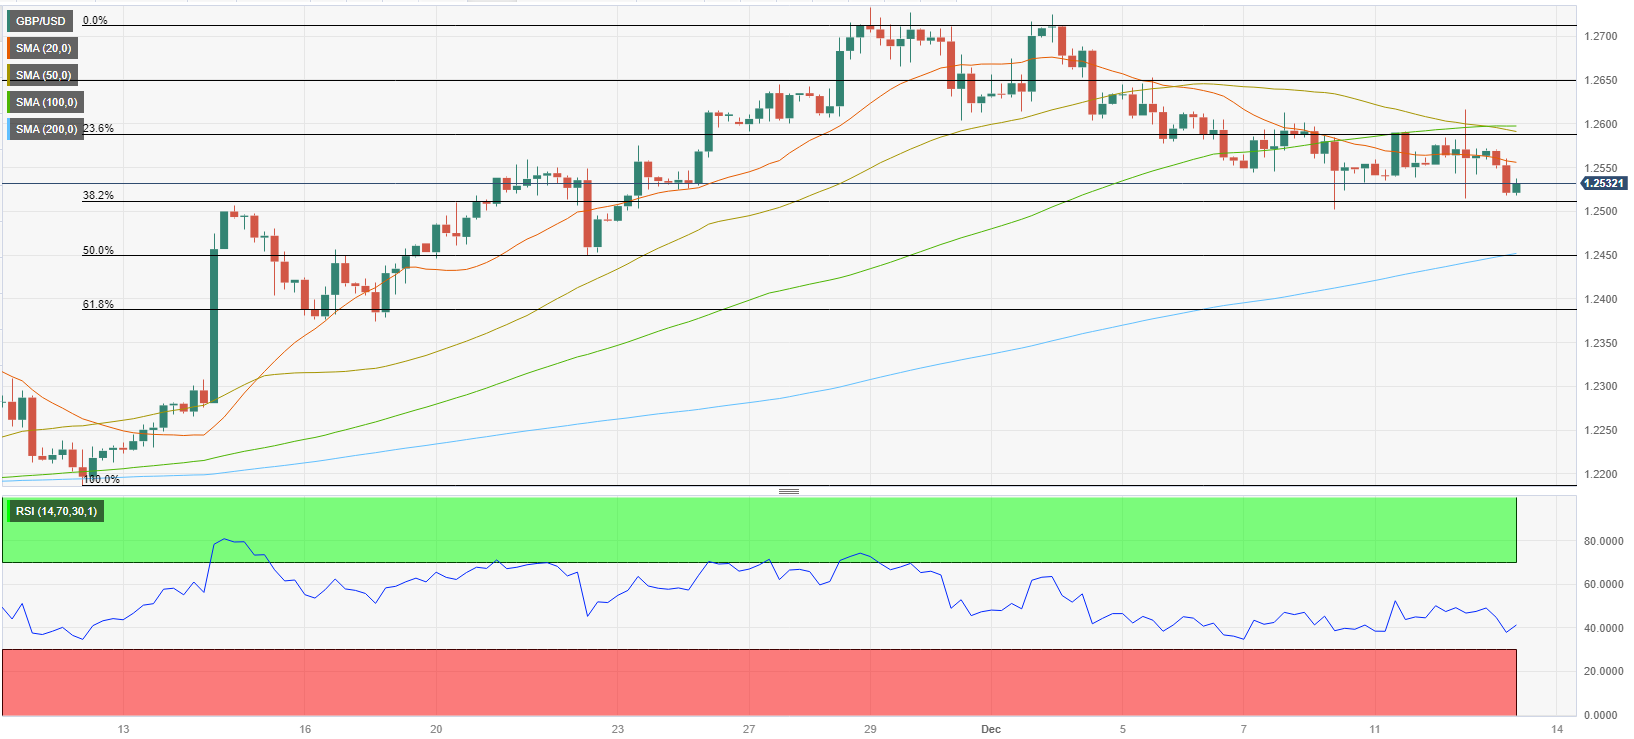
1.2500 (psychological level, Fibonacci 38.2% retracement of the latest uptrend) aligns as important support for GBP/USD. A 4-hour close below that level could attract technical sellers and open the door for another leg lower toward 1.2450 (200-period Simple Moving Average (SMA), Fibonacci 50% retracement) and 1.2400 (Fibonacci 61.8% retracement).
On the upside, 1.2550 (20-period SMA) aligns as interim resistance ahead of 1.2600 (100-period SMA, 50-period SMA) and 1.2650 (static level).
Meanwhile, the Relative Strength Index (RSI) indicator stays near 40, confirming the bearish bias.
Premium
You have reached your limit of 3 free articles for this month.
Start your subscription and get access to all our original articles.
Author

Eren Sengezer
FXStreet
As an economist at heart, Eren Sengezer specializes in the assessment of the short-term and long-term impacts of macroeconomic data, central bank policies and political developments on financial assets.


