GBP/USD Forecast: Pound needs to clear 1.1440 to extend rally
- GBP/USD advanced to a fresh two-week high above 1.1400 on Tuesday.
- The pair capitalizes on risk flows but it needs to clear 1.1440 to keep its bullish bias.
- UK PM Truss is likely to face further political backlash over fiscal policy.

GBP/USD has managed to build on Monday's impressive gains and climbed to its highest level in two weeks at 1.1421 on Tuesday. The pair seems to have gone into a consolidation phase in the European morning but buyers could continue to dominate its action in case 1.1440 resistance fails.
In a U-turn on Monday, the UK government decided to abandon its plan to cut taxes for high earners. UK gilt yields continued to fall following this announcement and the British pound outperformed its rivals.
In the second half of the day, the risk-positive market environment weighed heavily on the greenback and helped GBP/USD preserve its bullish momentum. The ISM Manufacturing PMI survey revealed that price pressures eased at a stronger pace than expected in September while employment contracted. The probability of a 75 bps Fed rate hike in November declined to 50% after the PMI survey and the dollar selloff picked up steam.
Early Tuesday, US stock index futures are up between 1.2% and 1.8%, suggesting that risk flows are likely to drive the market action during the American session. The US economic docket will feature JOLTS Job Openings and Factory Orders figures for August but these data are unlikely to impact the risk perception in a noticeable way.
Meanwhile, when asked whether her government would raise benefit payments in line with inflation by BBC earlier today, "we have to look at these issues in the round, we have to be fiscally responsible," British Prime Minister Liz Truss responded. Truss is likely to face further political backlash over her refusal to rule out a real-term cut to benefits as she is yet to come up with a plan to explain how the government will pay for tax cuts. In case political tensions continue to escalate in the UK, the British pound could find it hard to extend its rally.
GBP/USD Technical Analysis
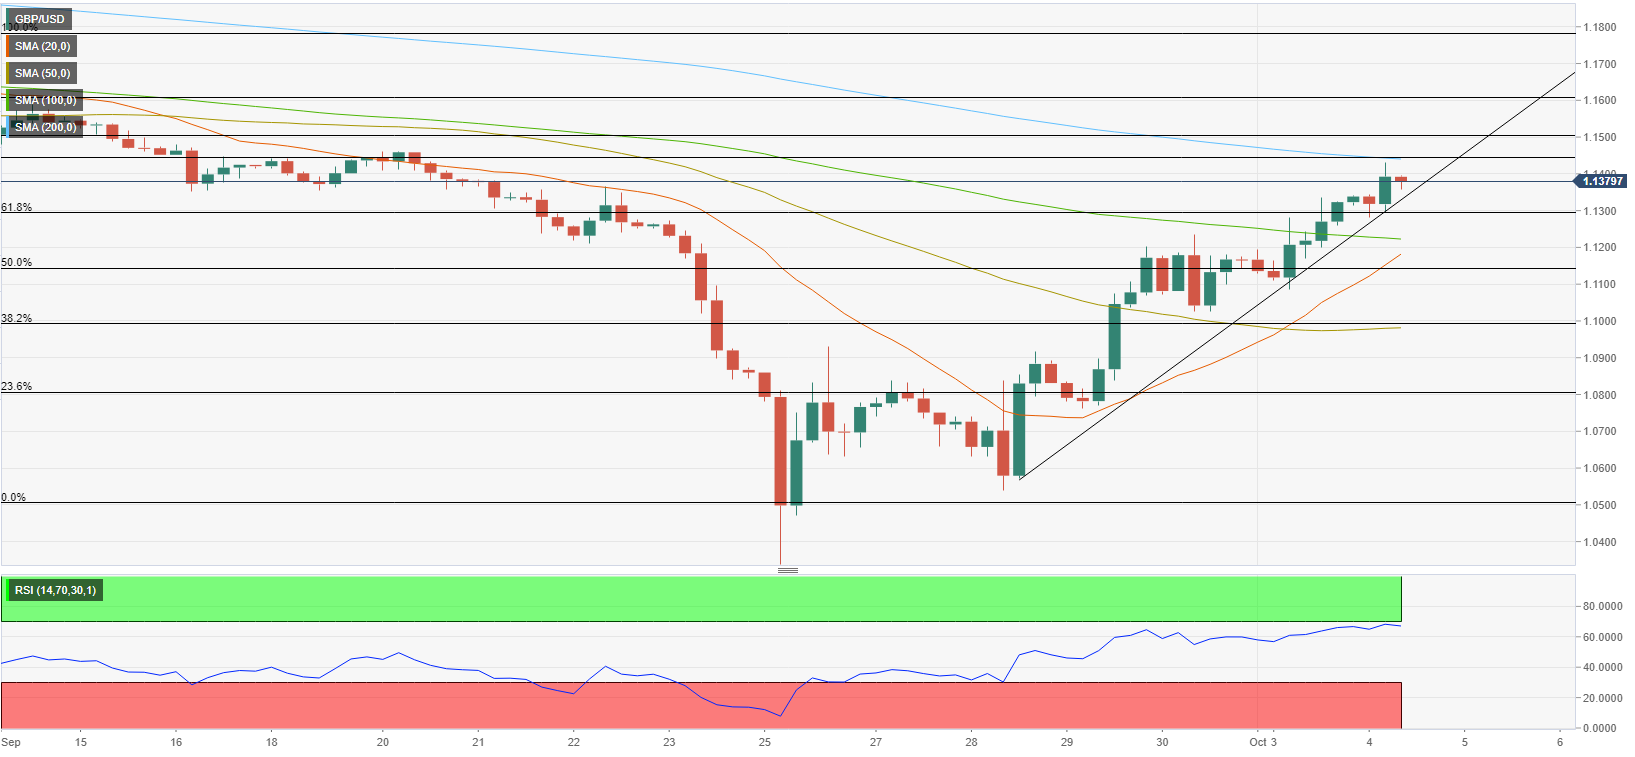
On the four-hour chart, the Relative Strength Index (RSI) indicator stays within a touching distance of 70, suggesting that the pair could make a downward correction before the next leg higher. On the upside, 1.1440 (200-period SMA) aligns as key resistance. In case buyers flip that level into support, GBP/USD could target 1.1500 (psychological level) and 1.1600 (psychological level).
The ascending trend line coming from September 28 aligns as key support at 1.1350 ahead of 1.1300 (psychological level, Fibonacci 61.8% retracement of the latest downtrend) and 1.1225 (100-period SMA).
Premium
You have reached your limit of 3 free articles for this month.
Start your subscription and get access to all our original articles.
Author

Eren Sengezer
FXStreet
As an economist at heart, Eren Sengezer specializes in the assessment of the short-term and long-term impacts of macroeconomic data, central bank policies and political developments on financial assets.


